Biometrics Northwest LLC
Performing Data Analysis and Modeling
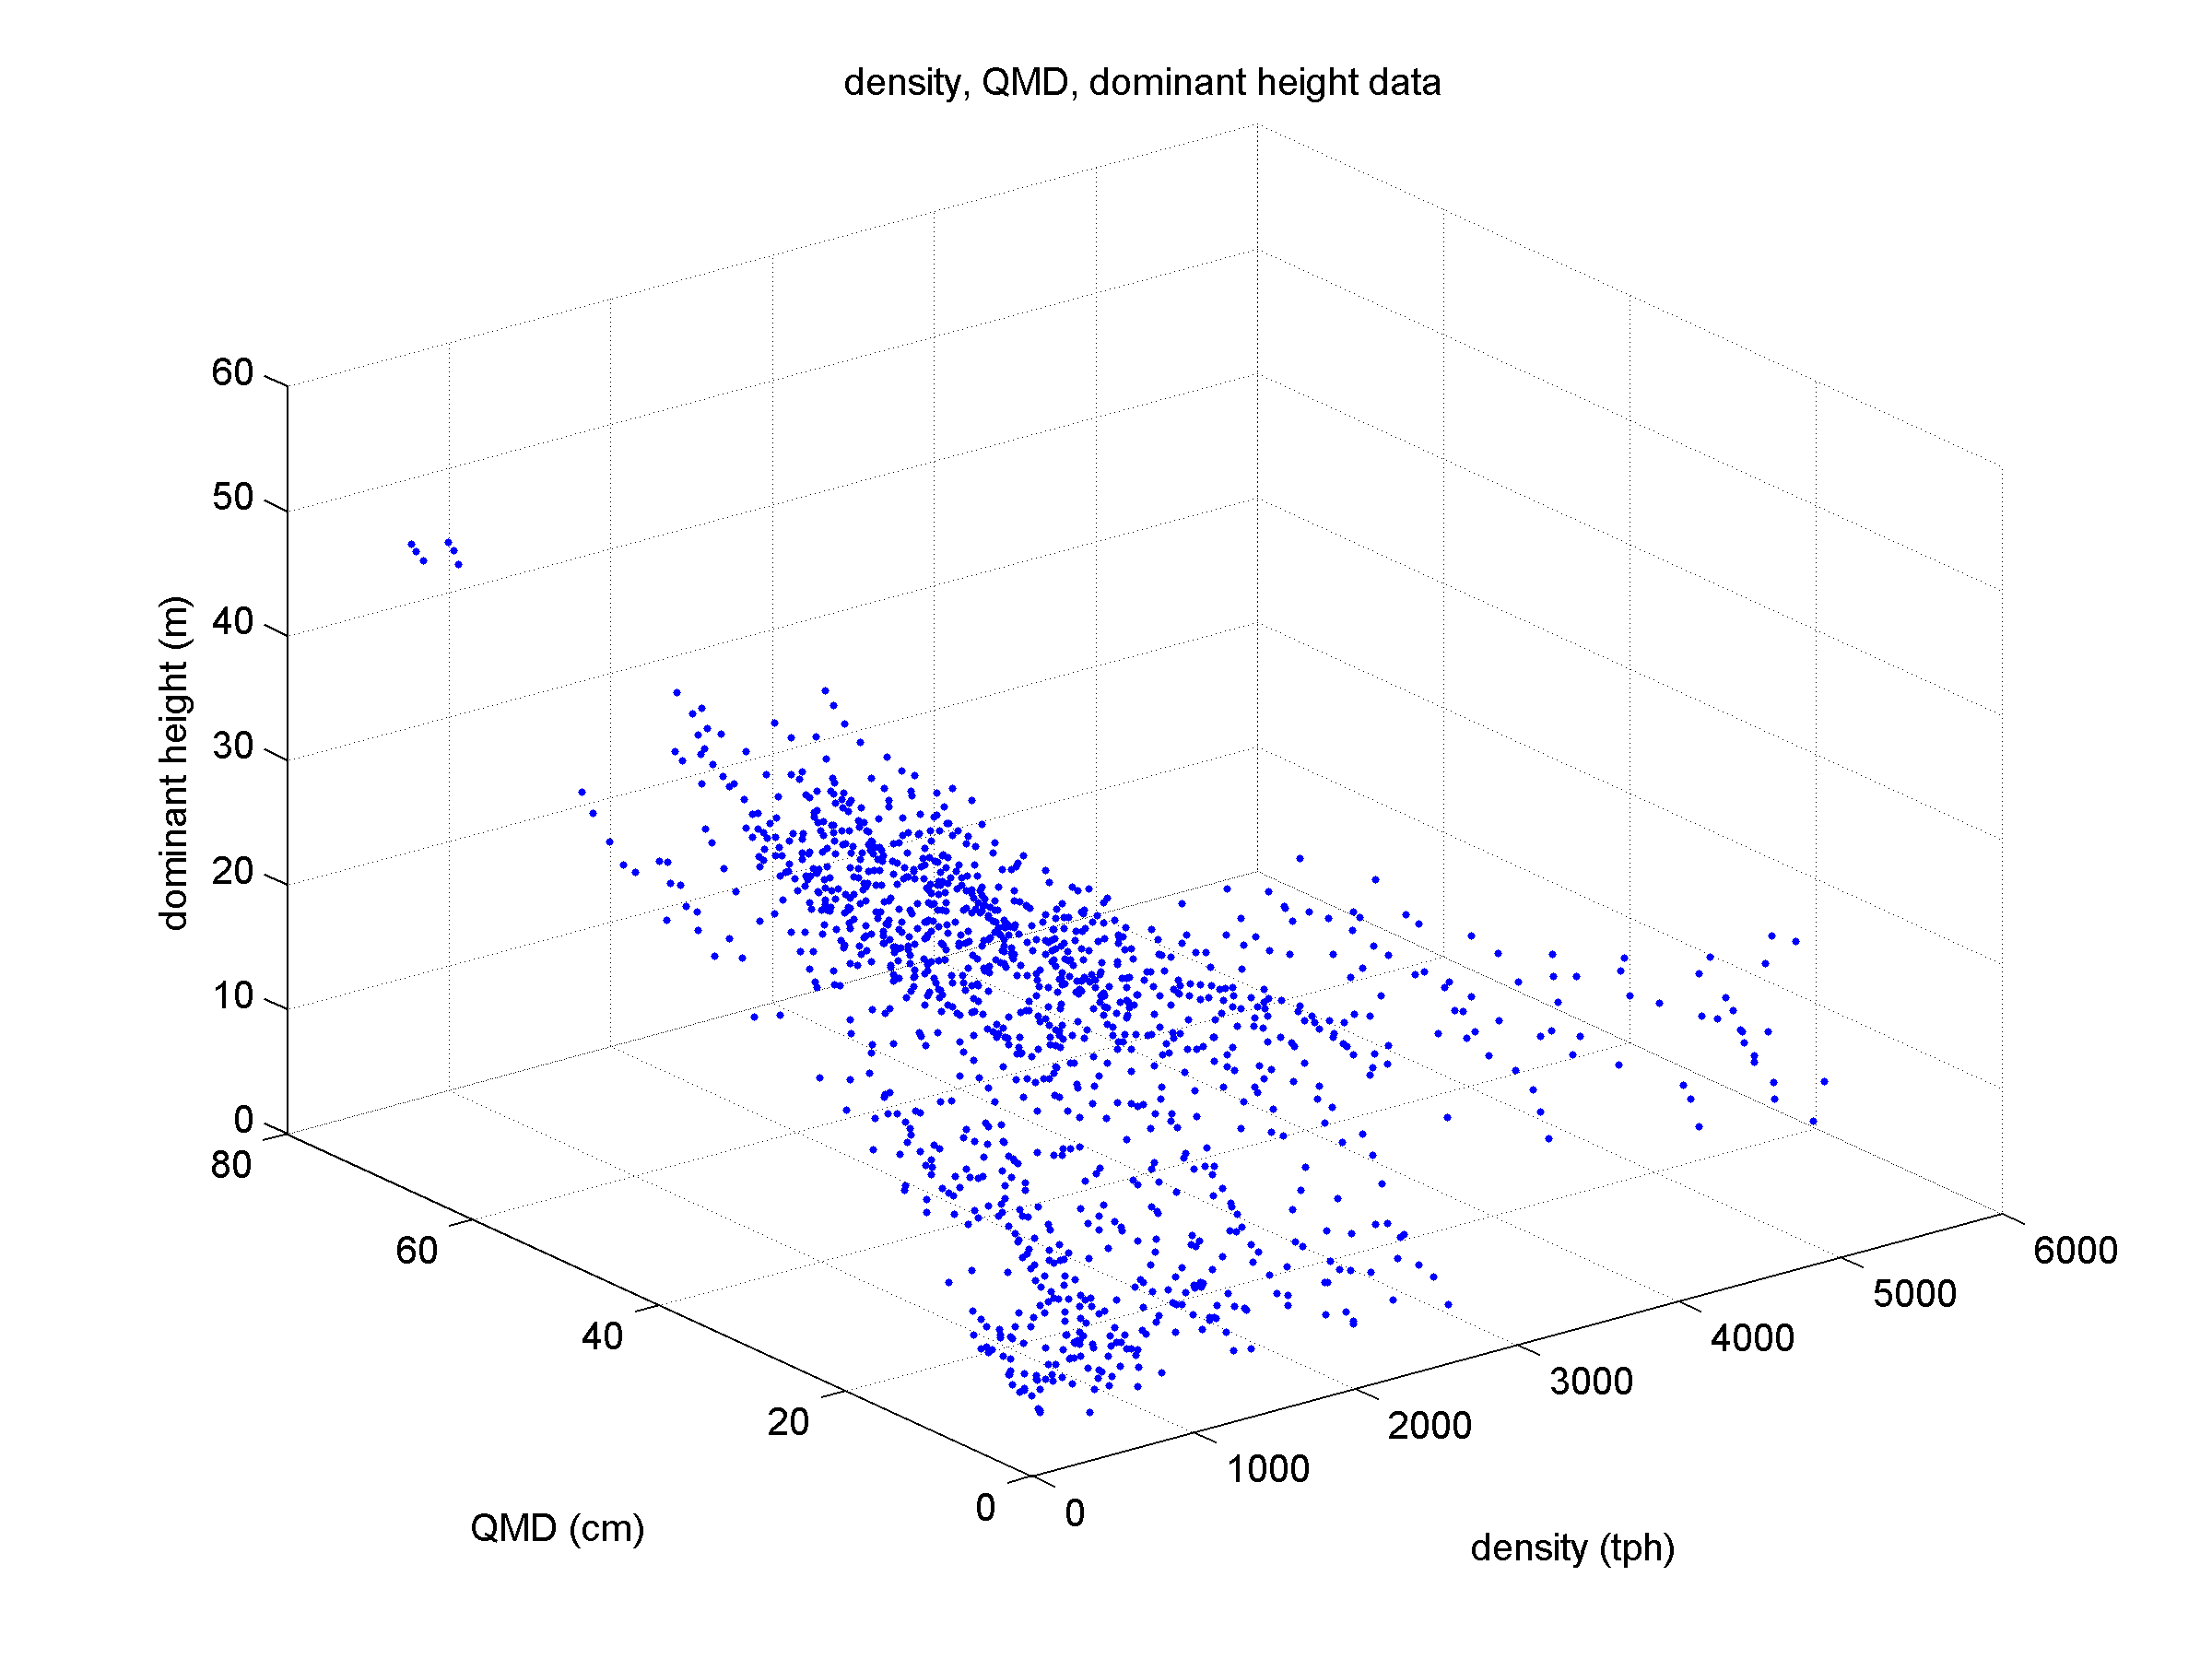
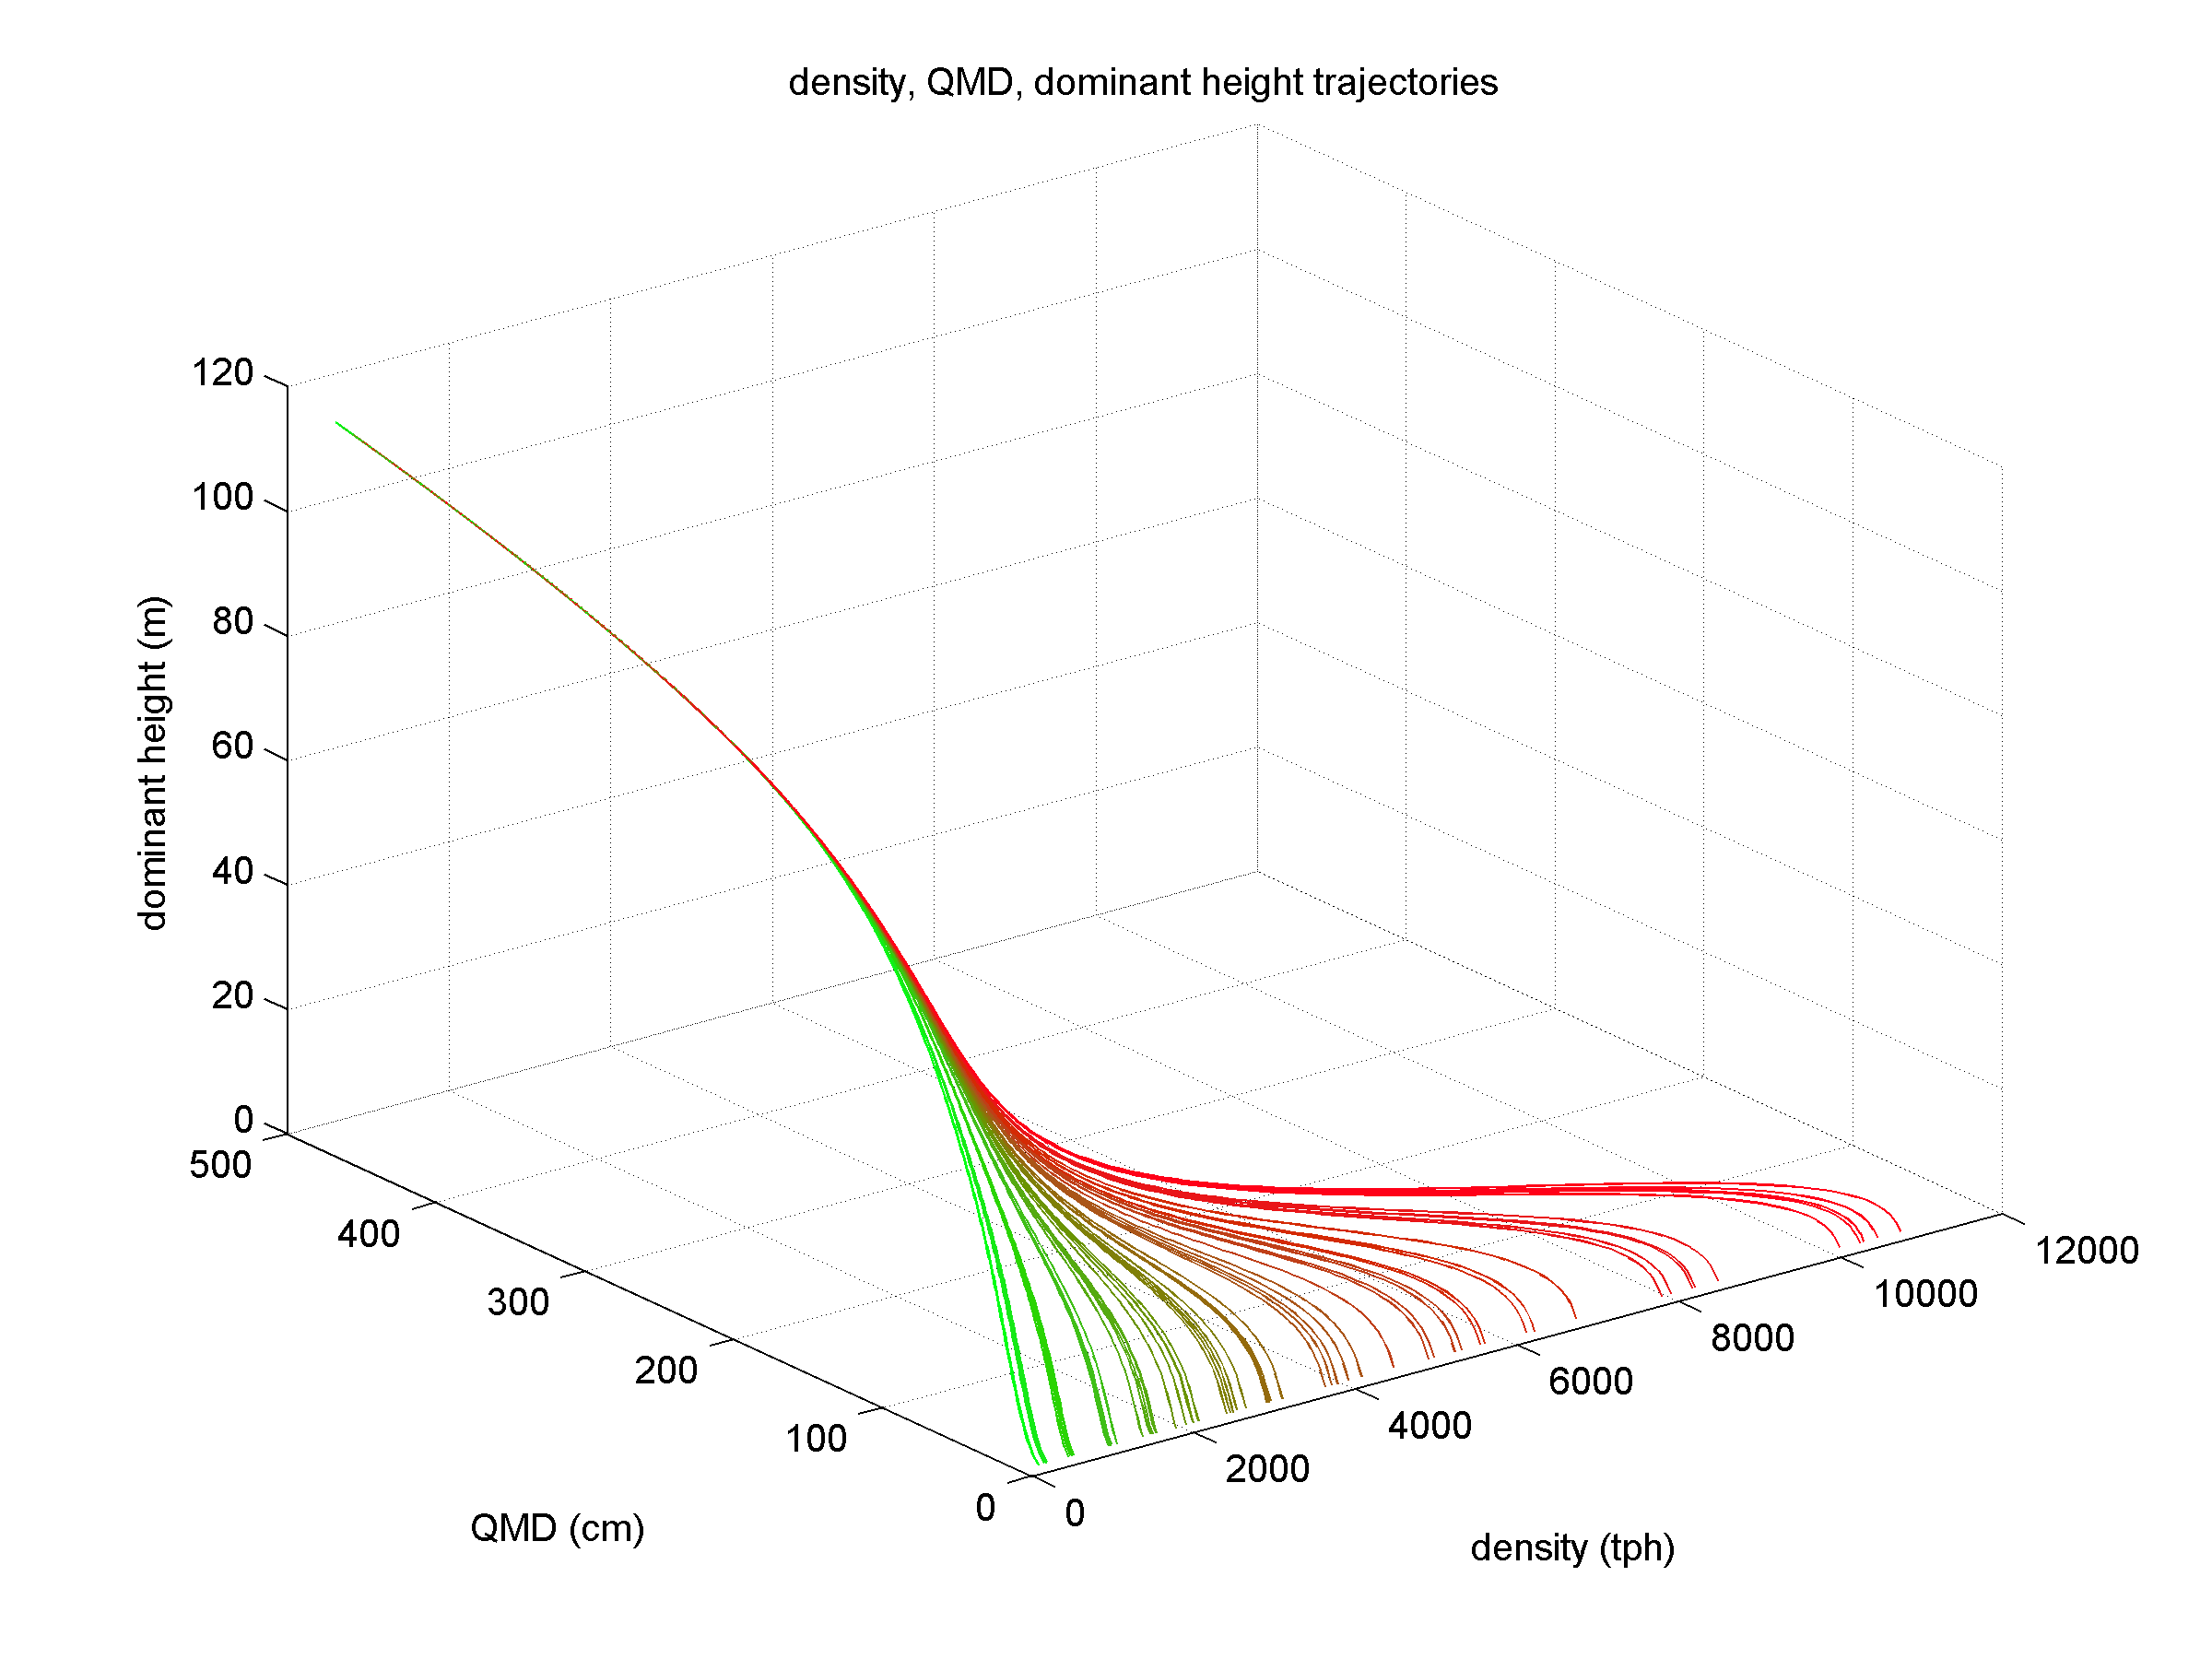
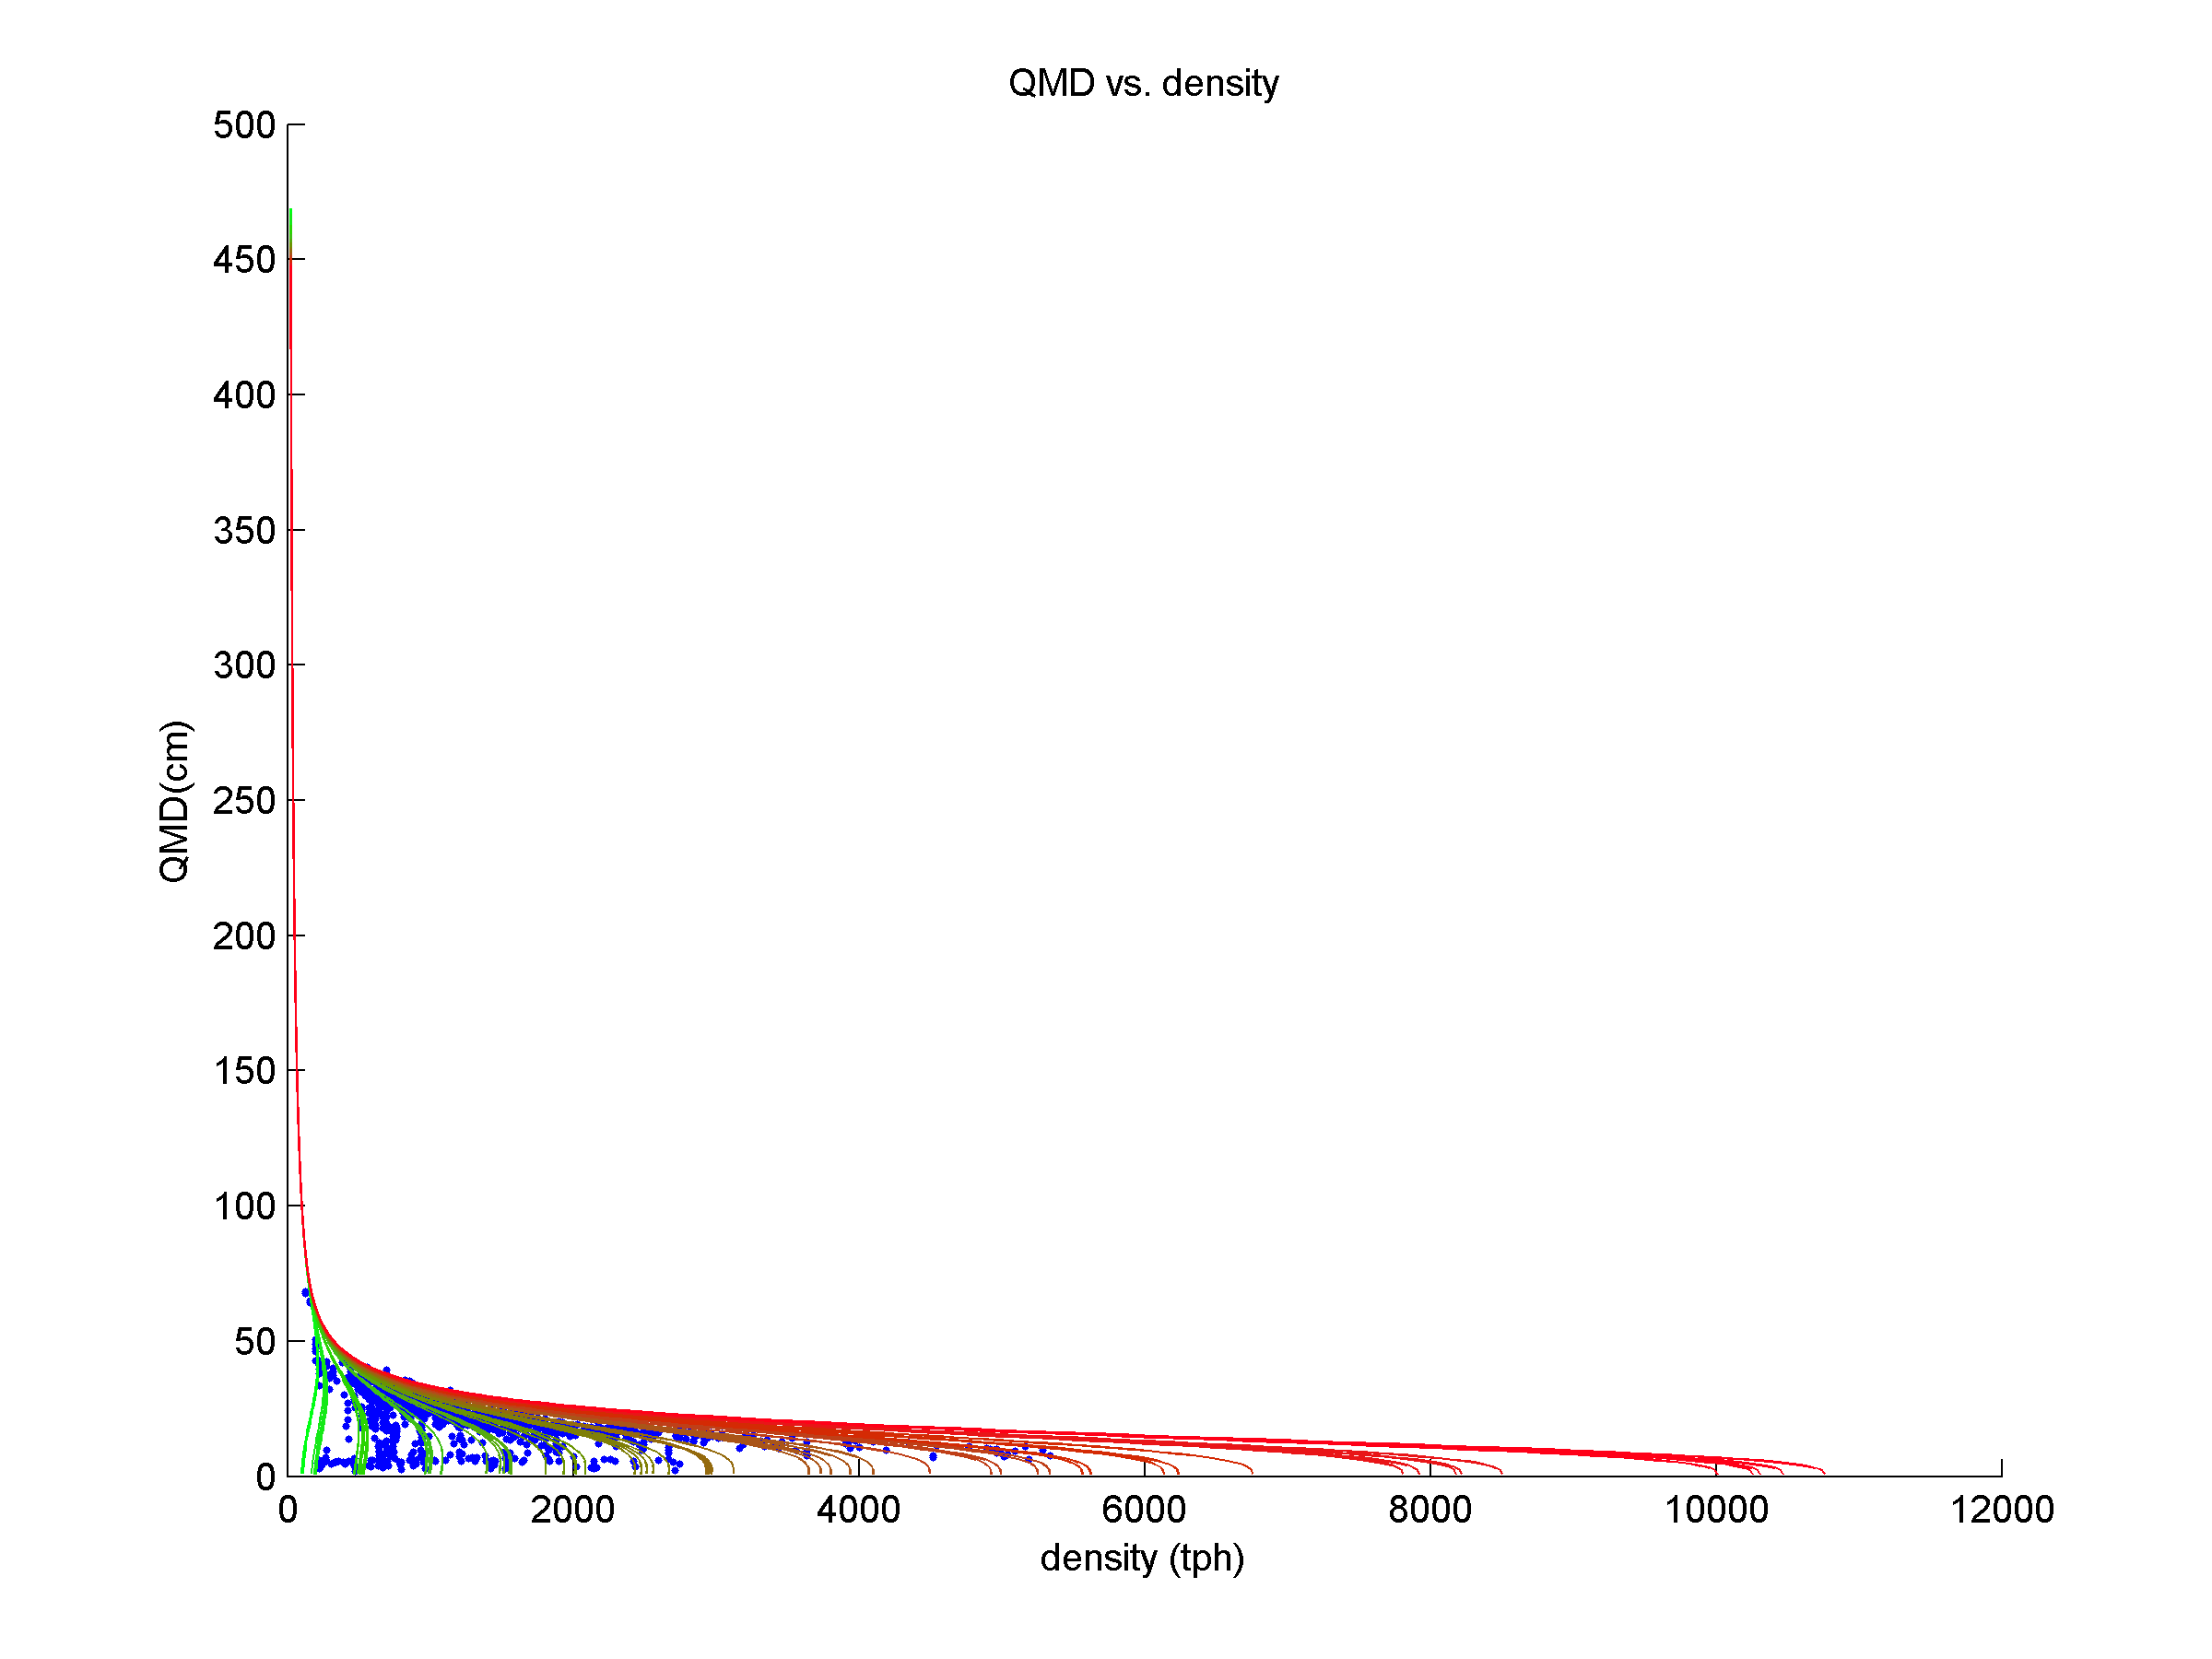
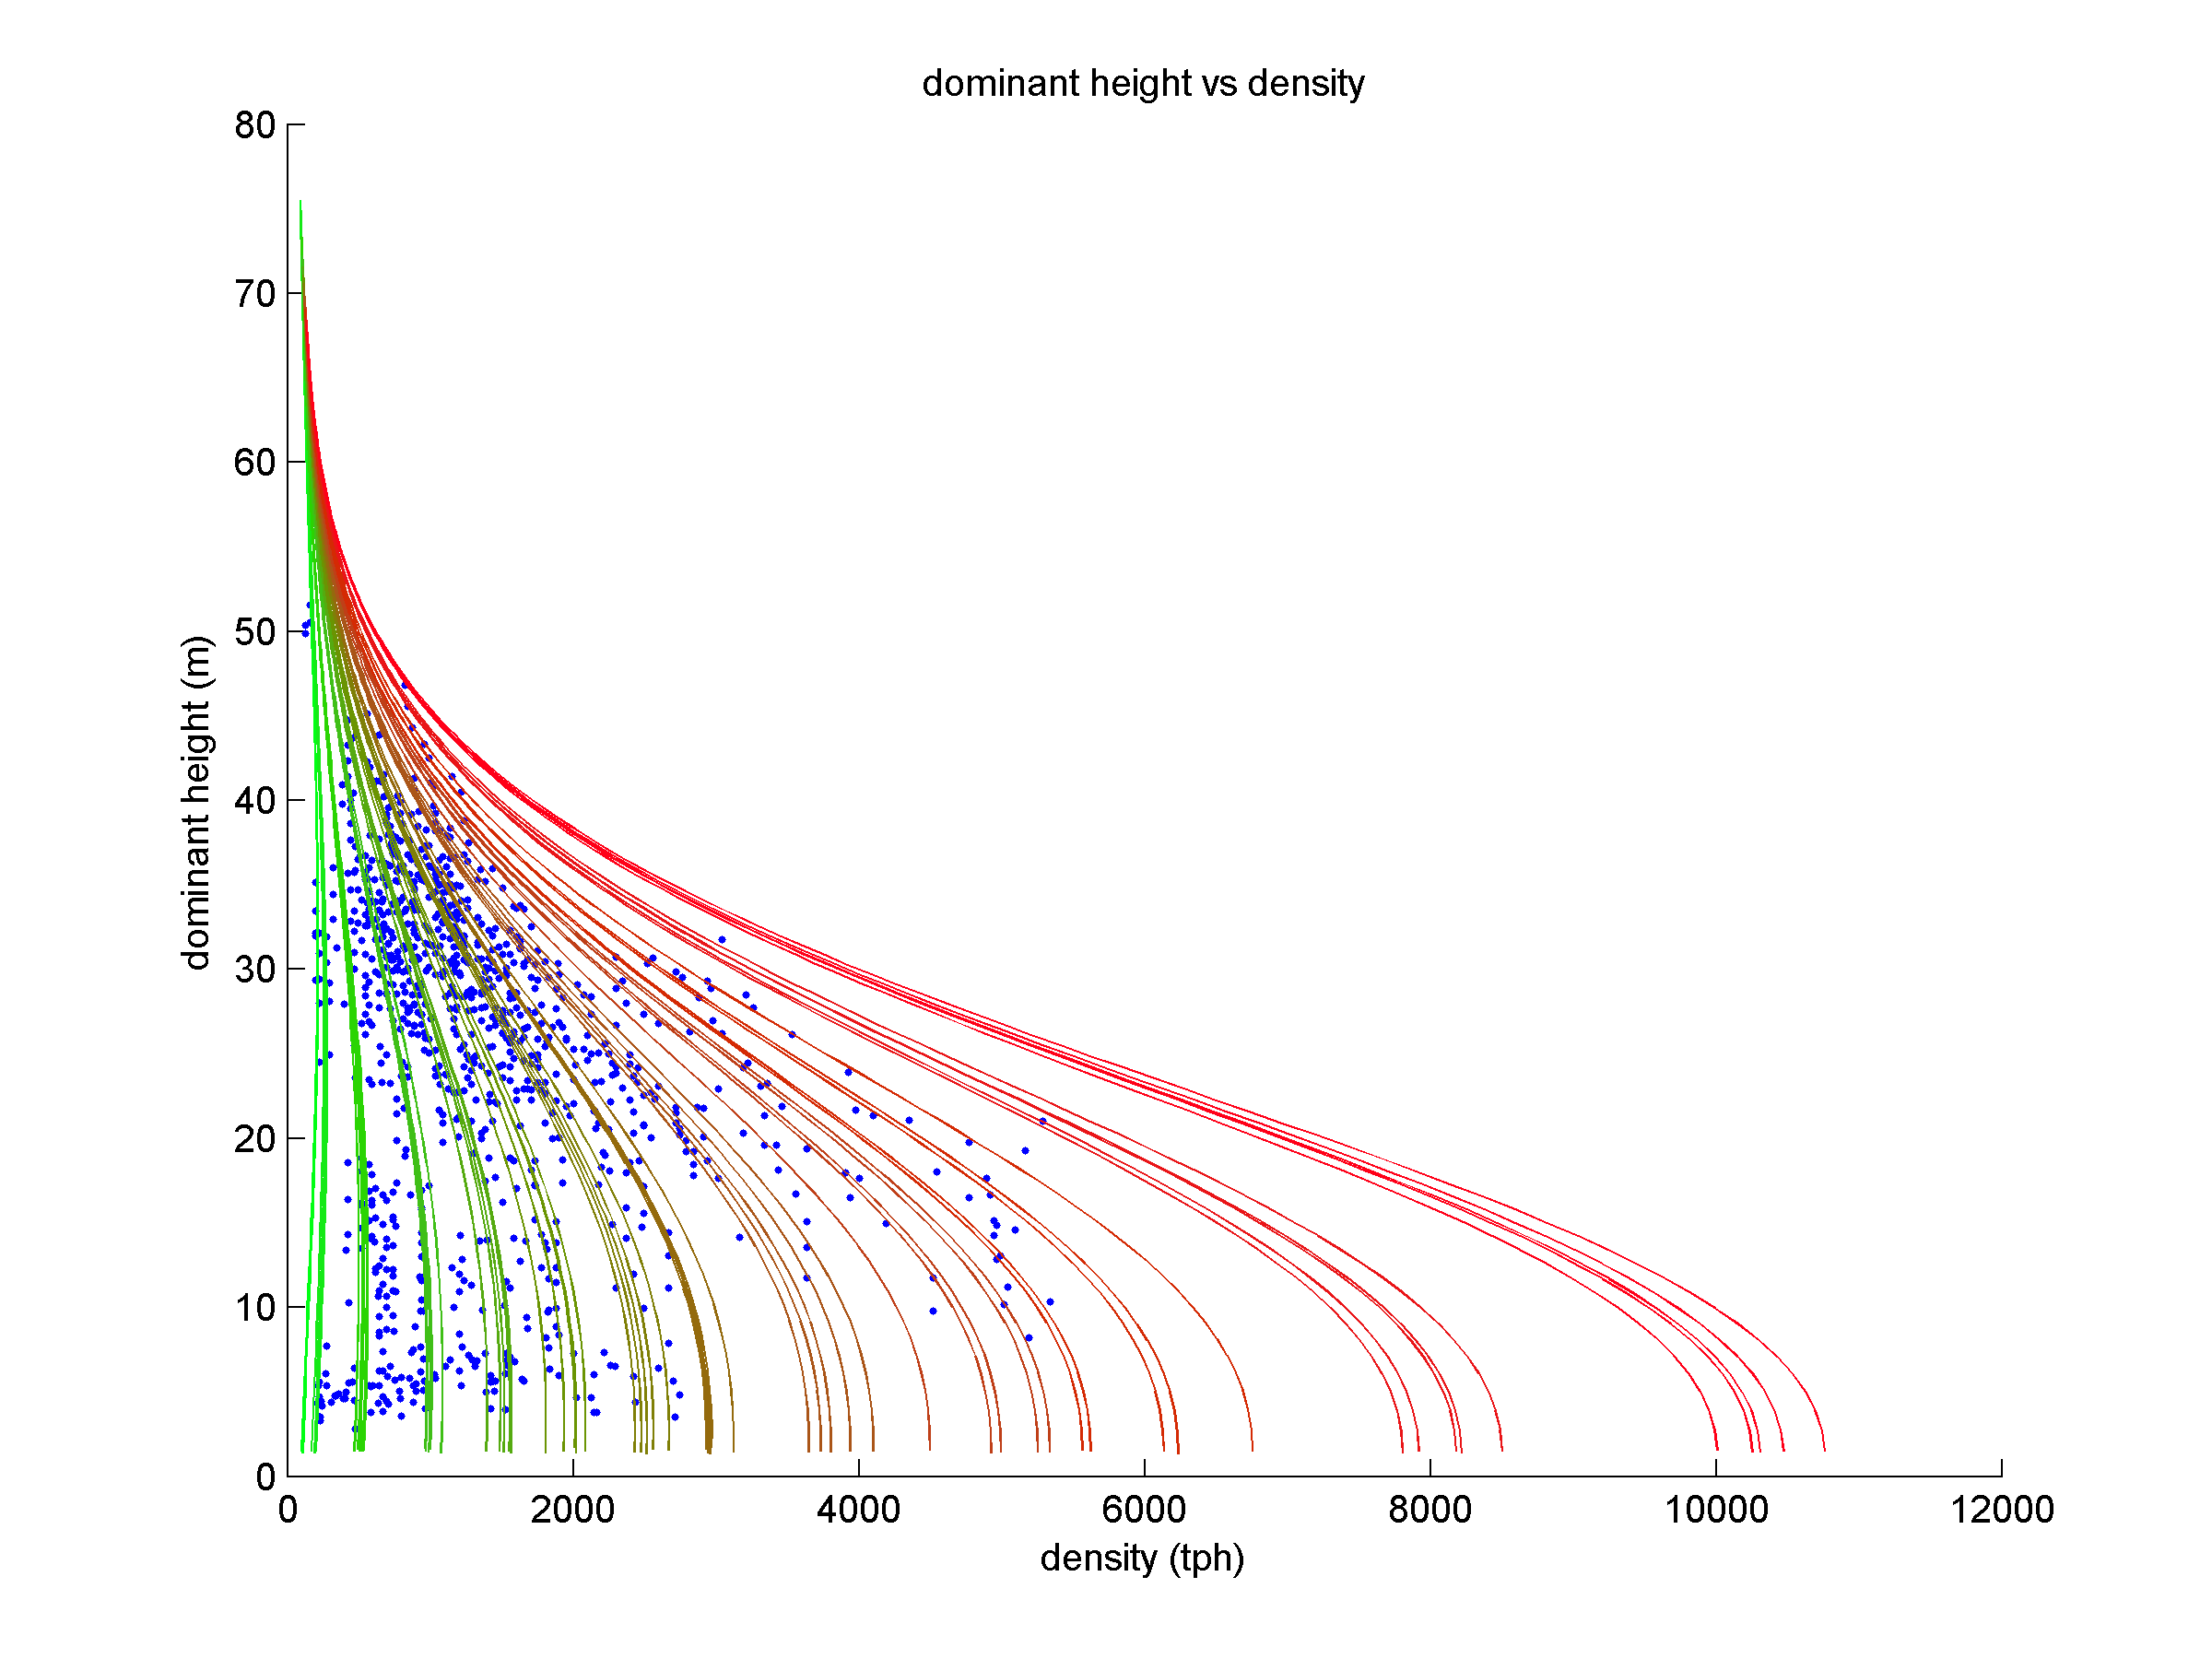
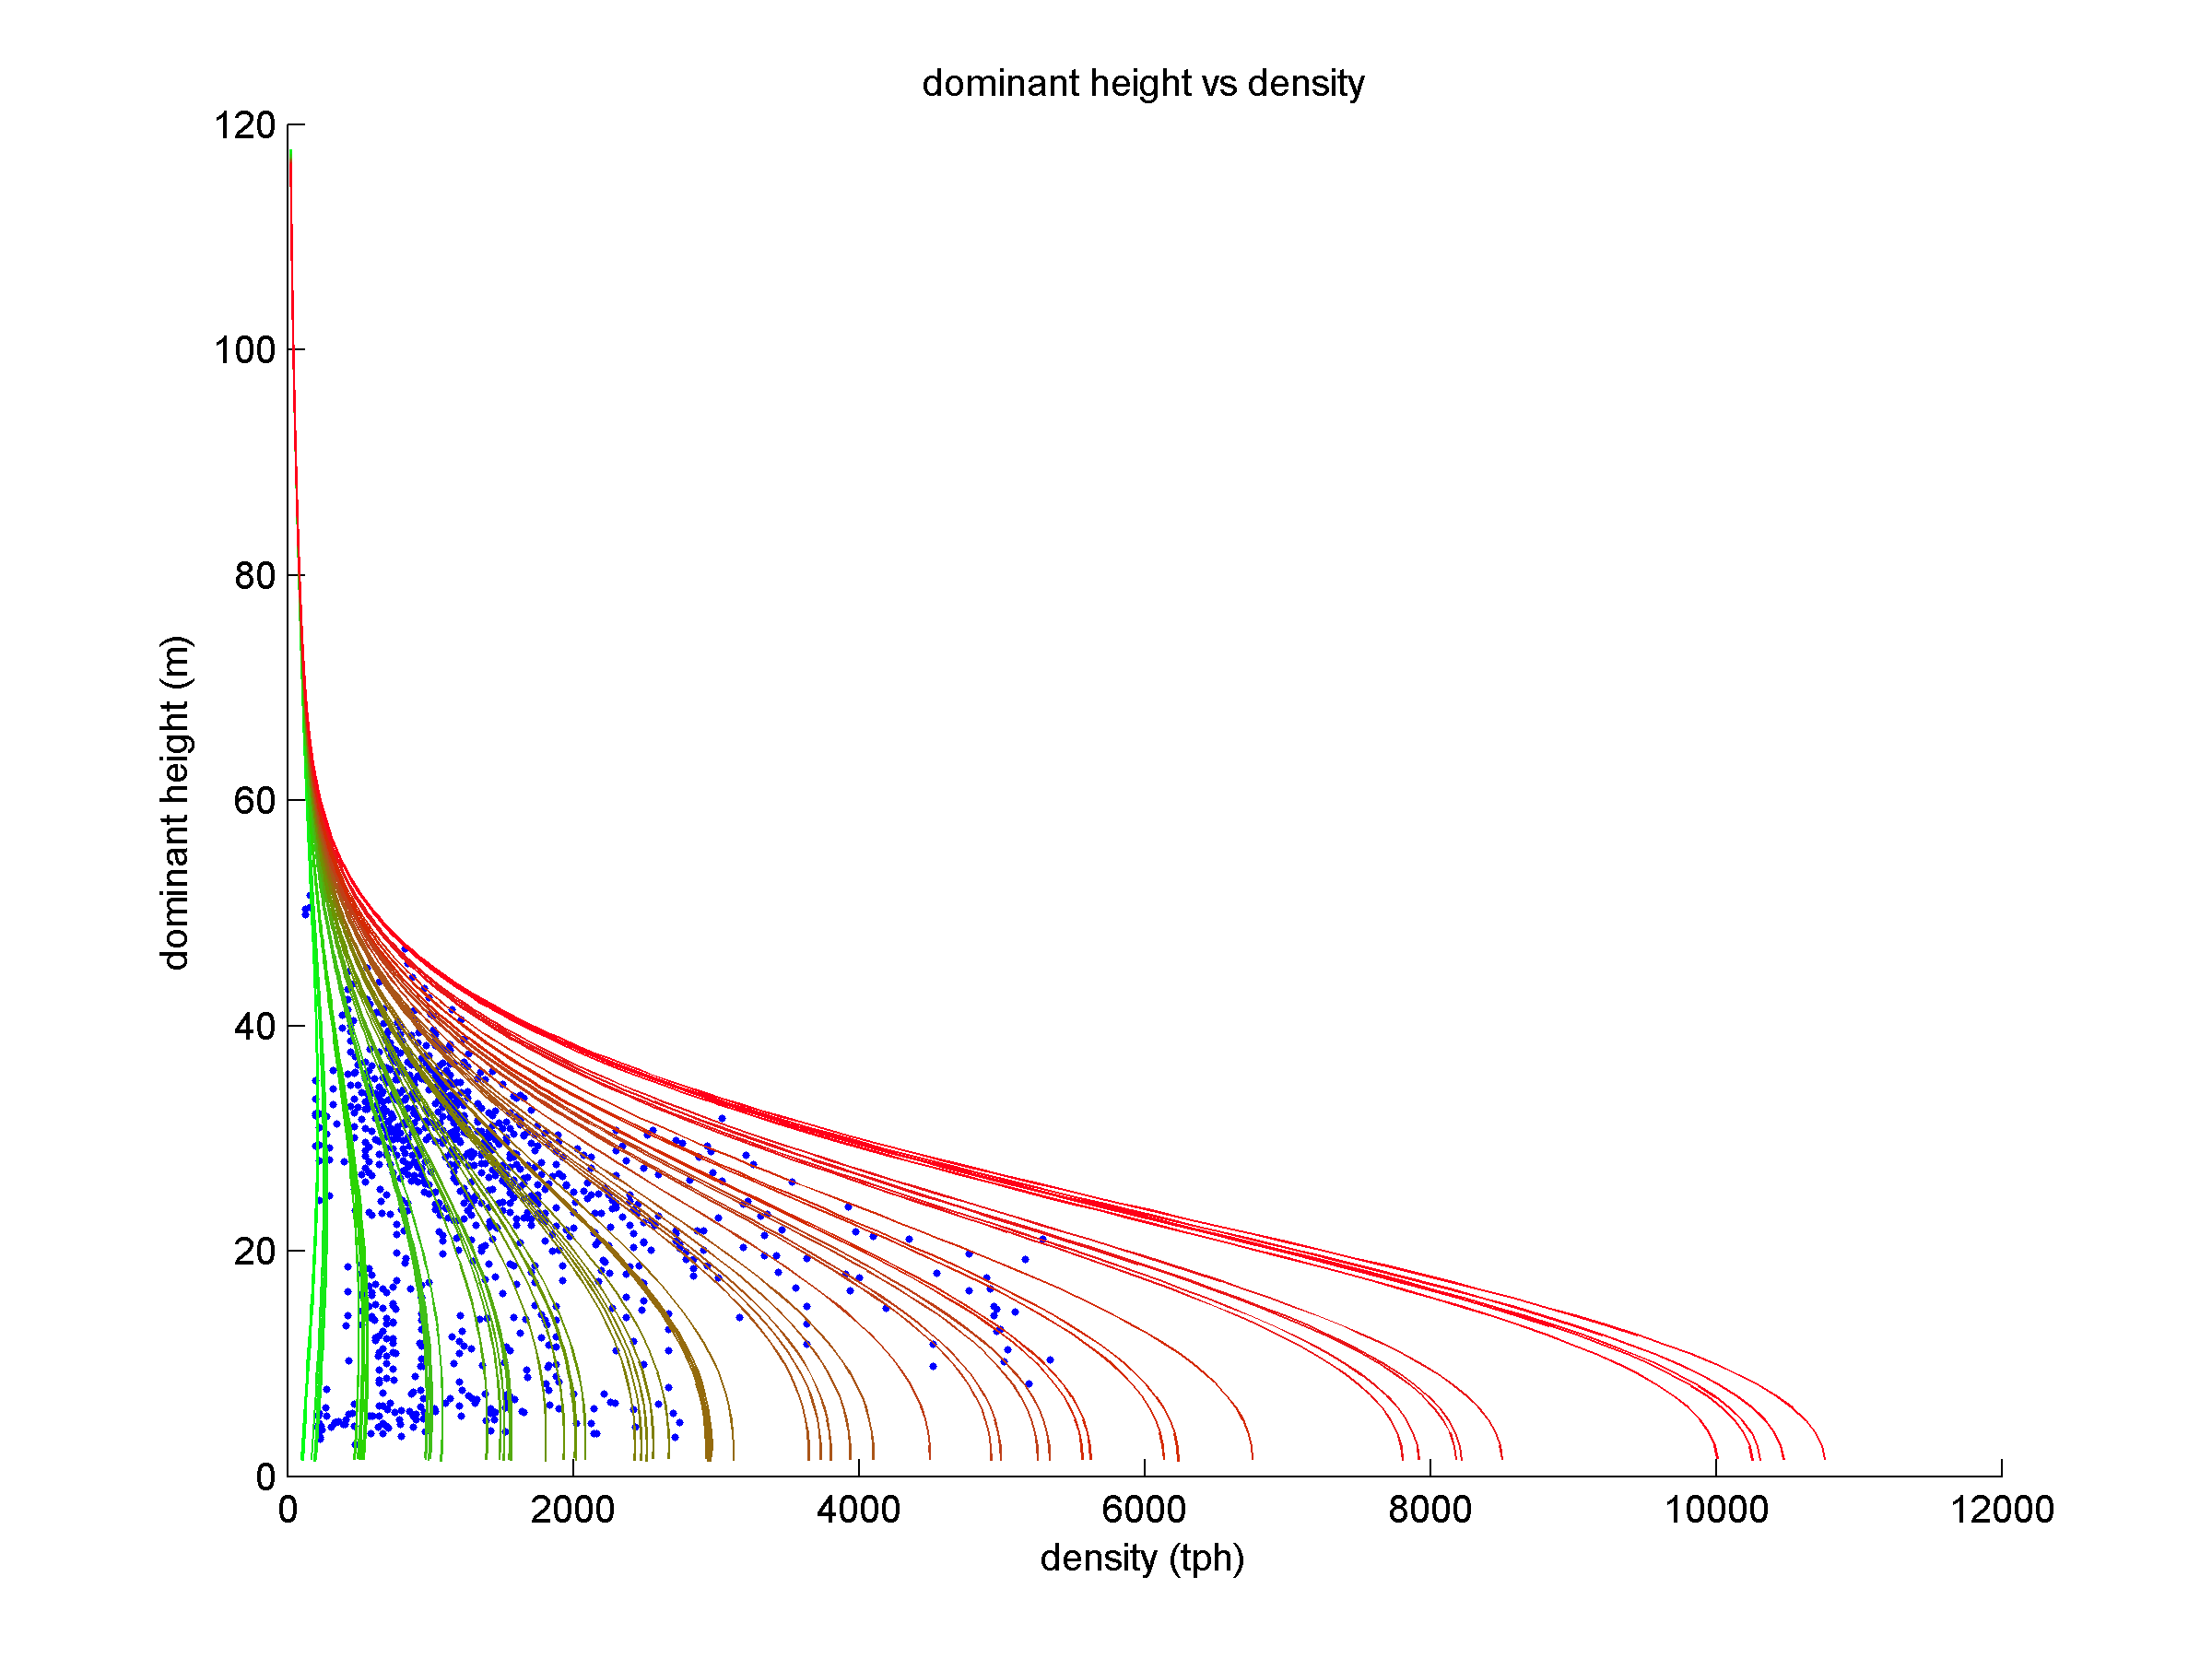
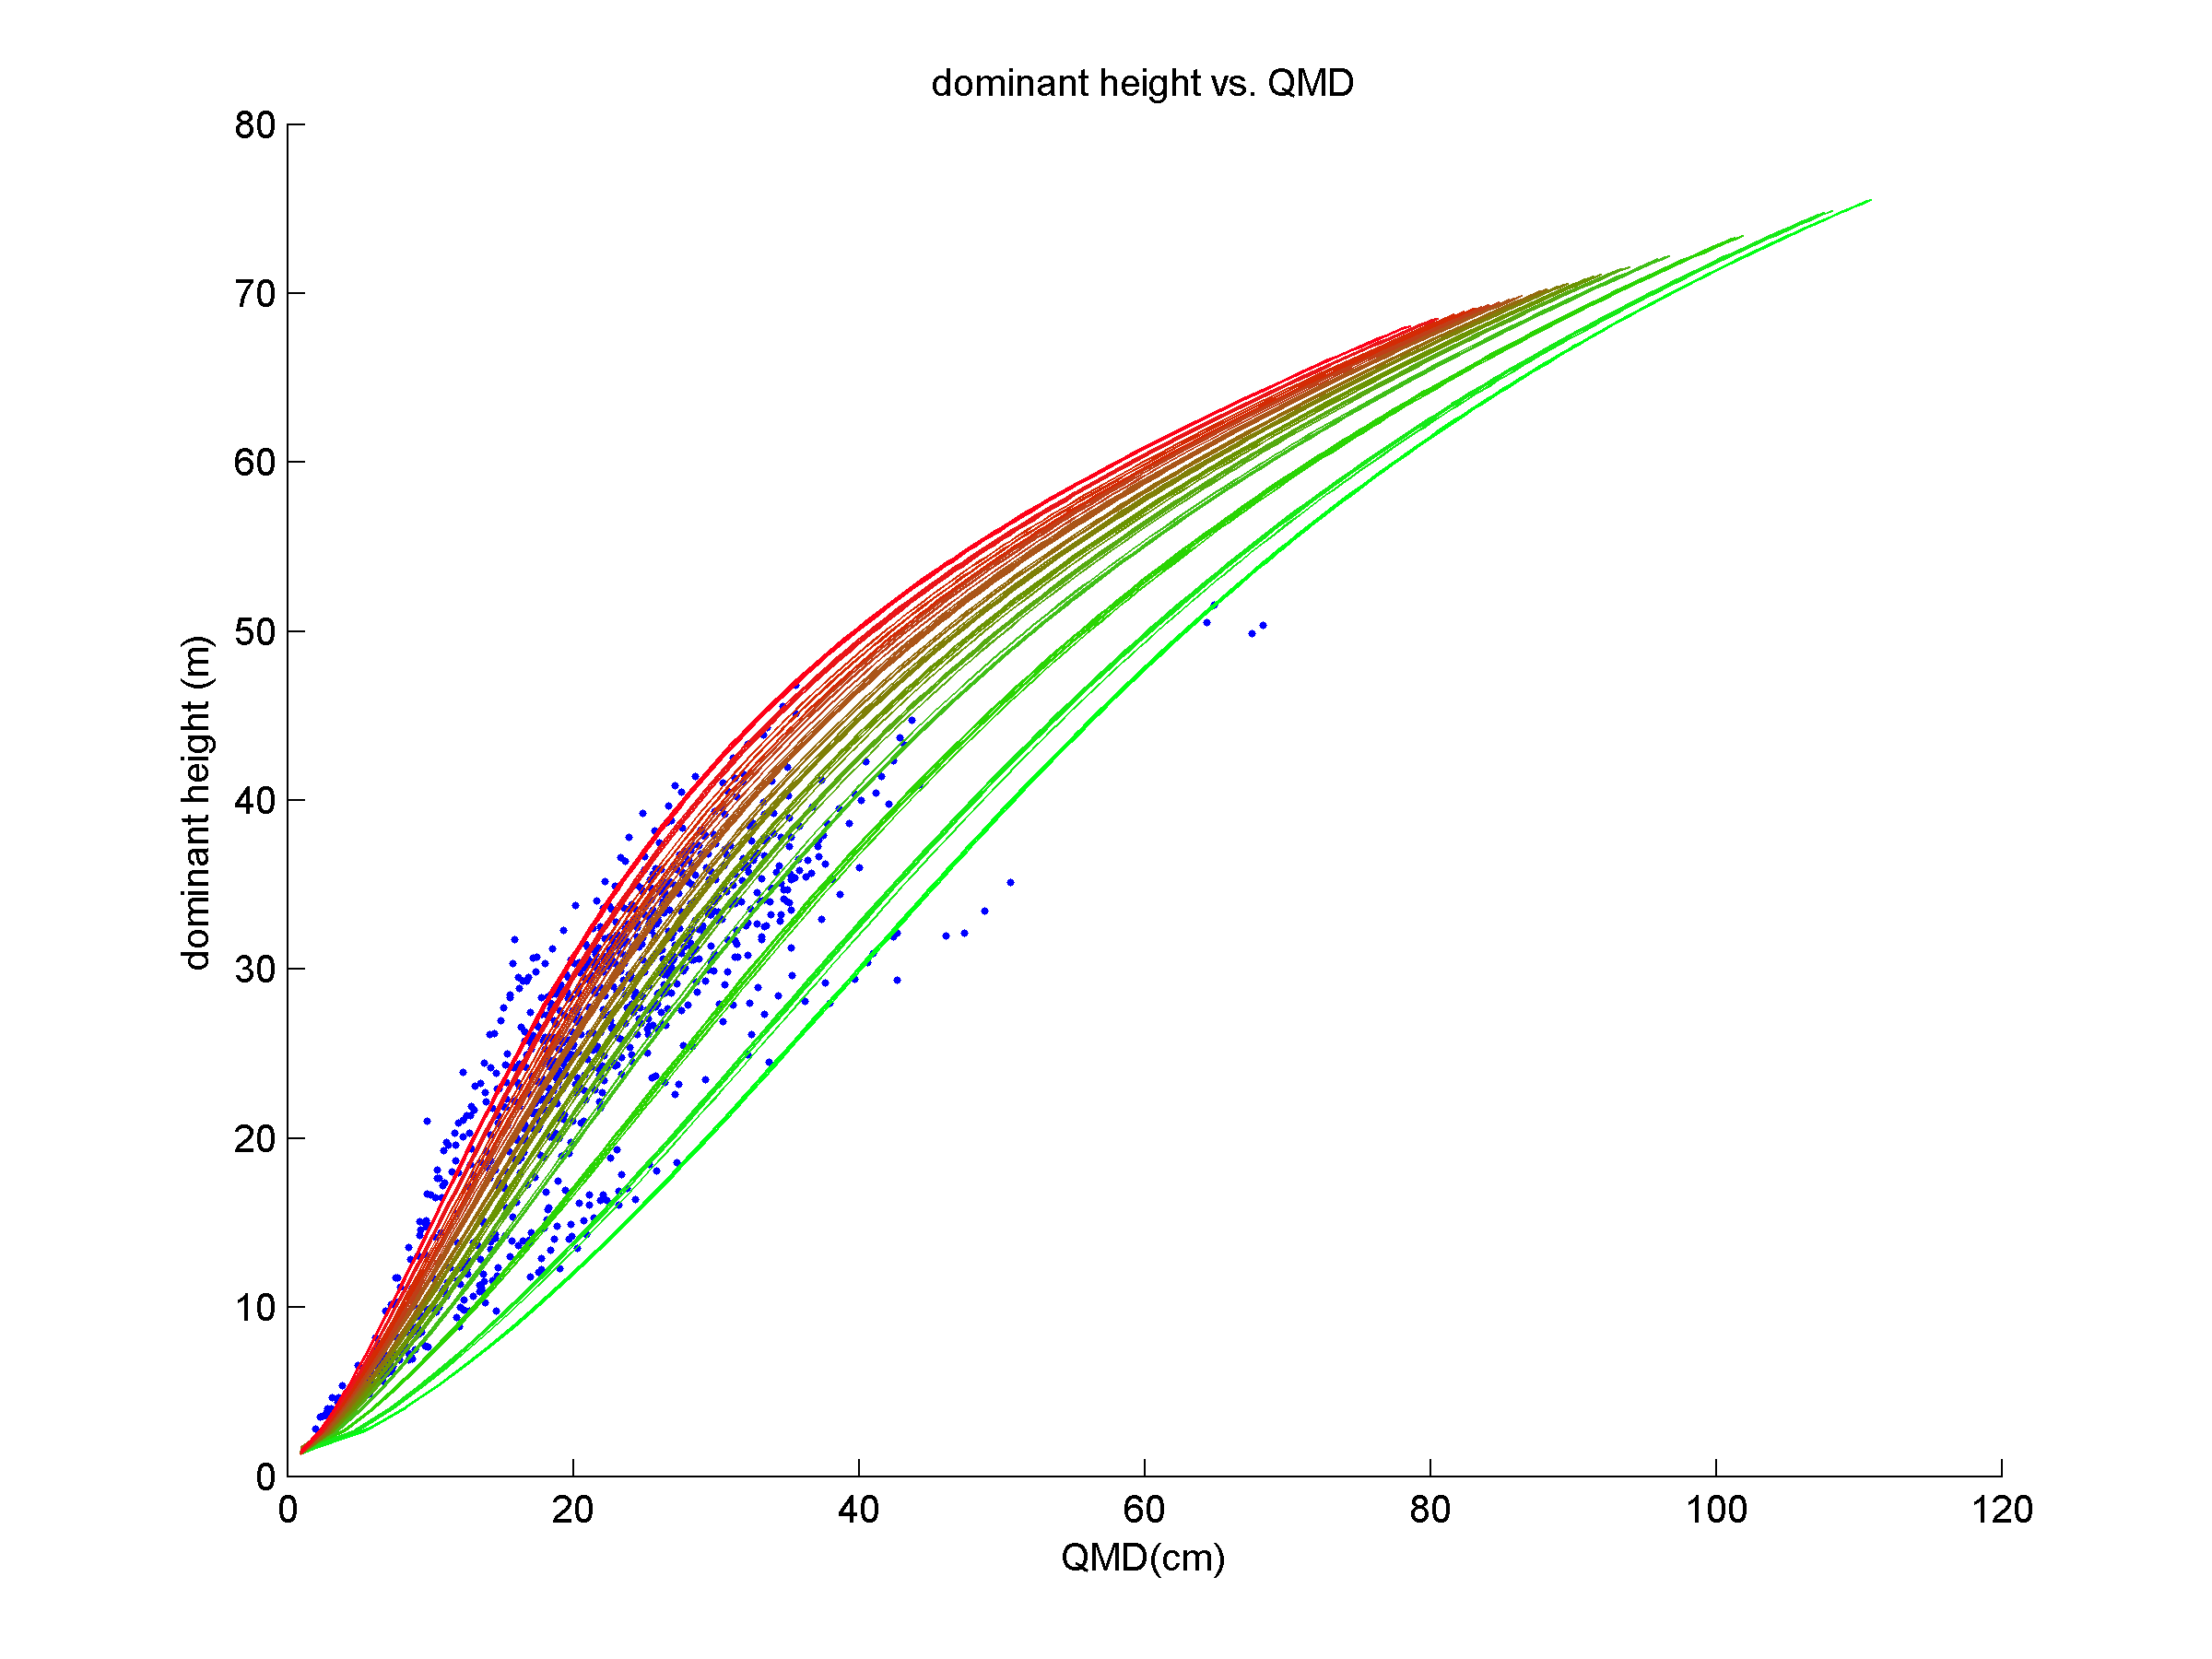
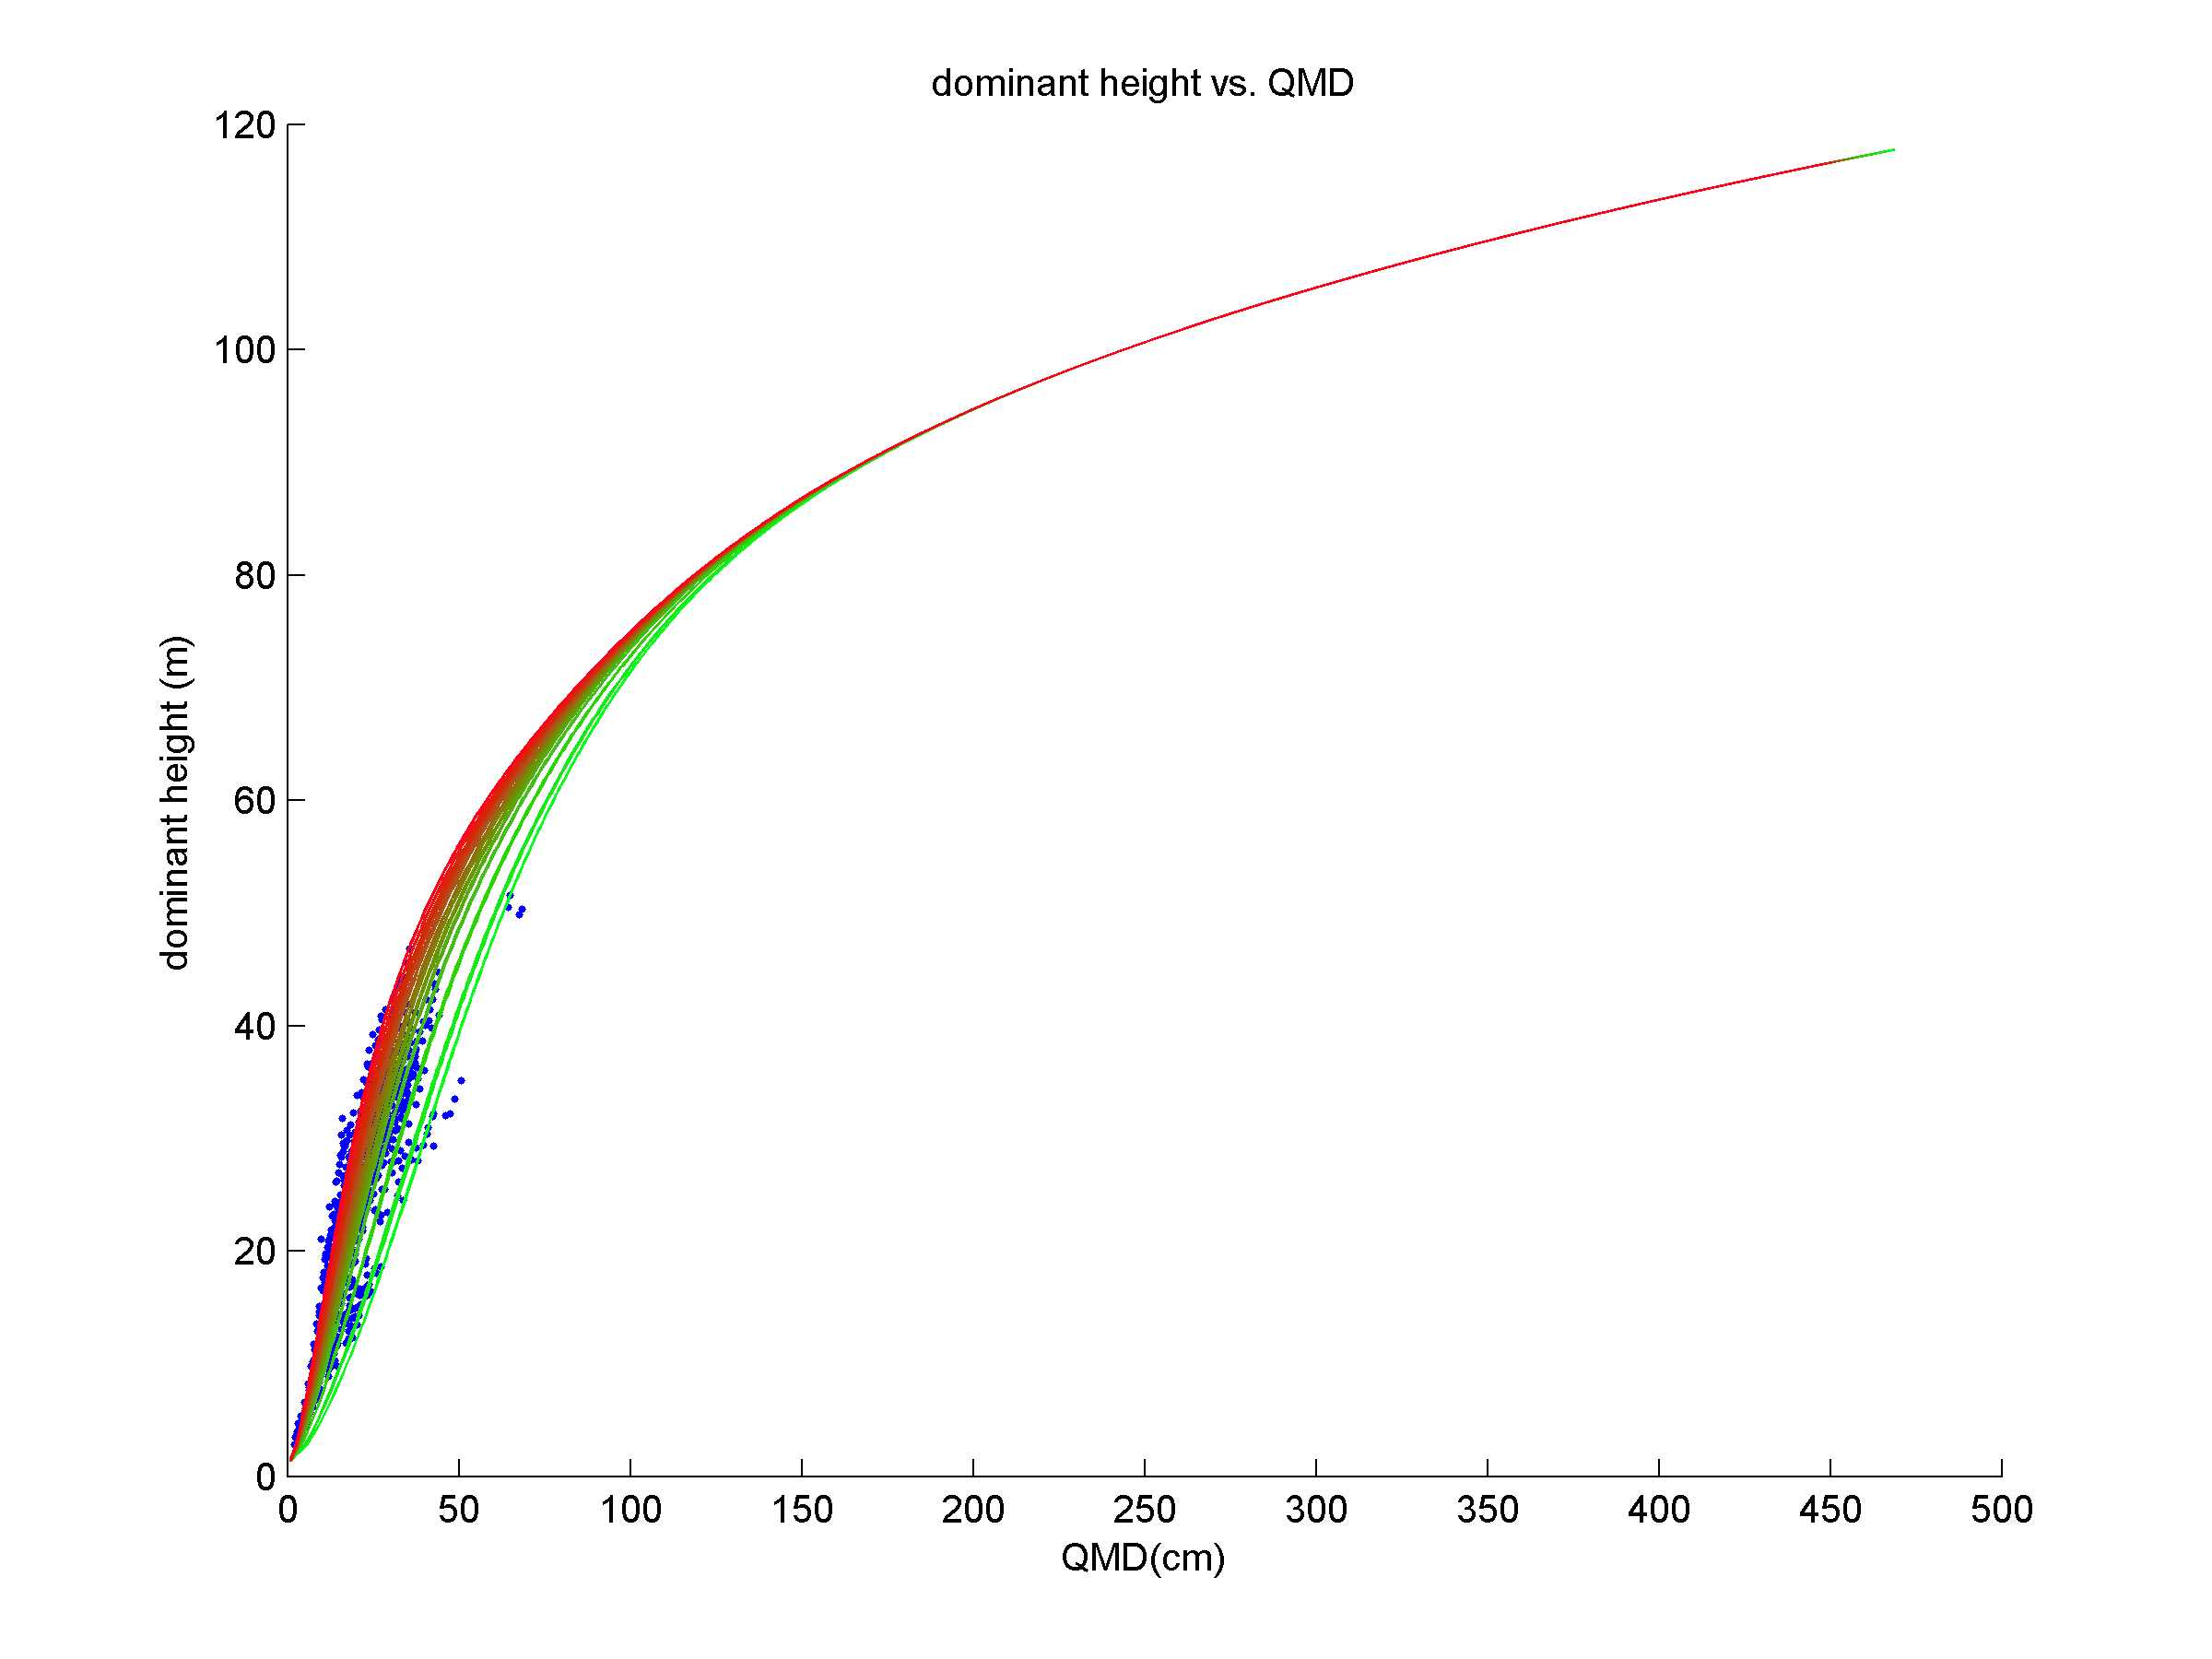
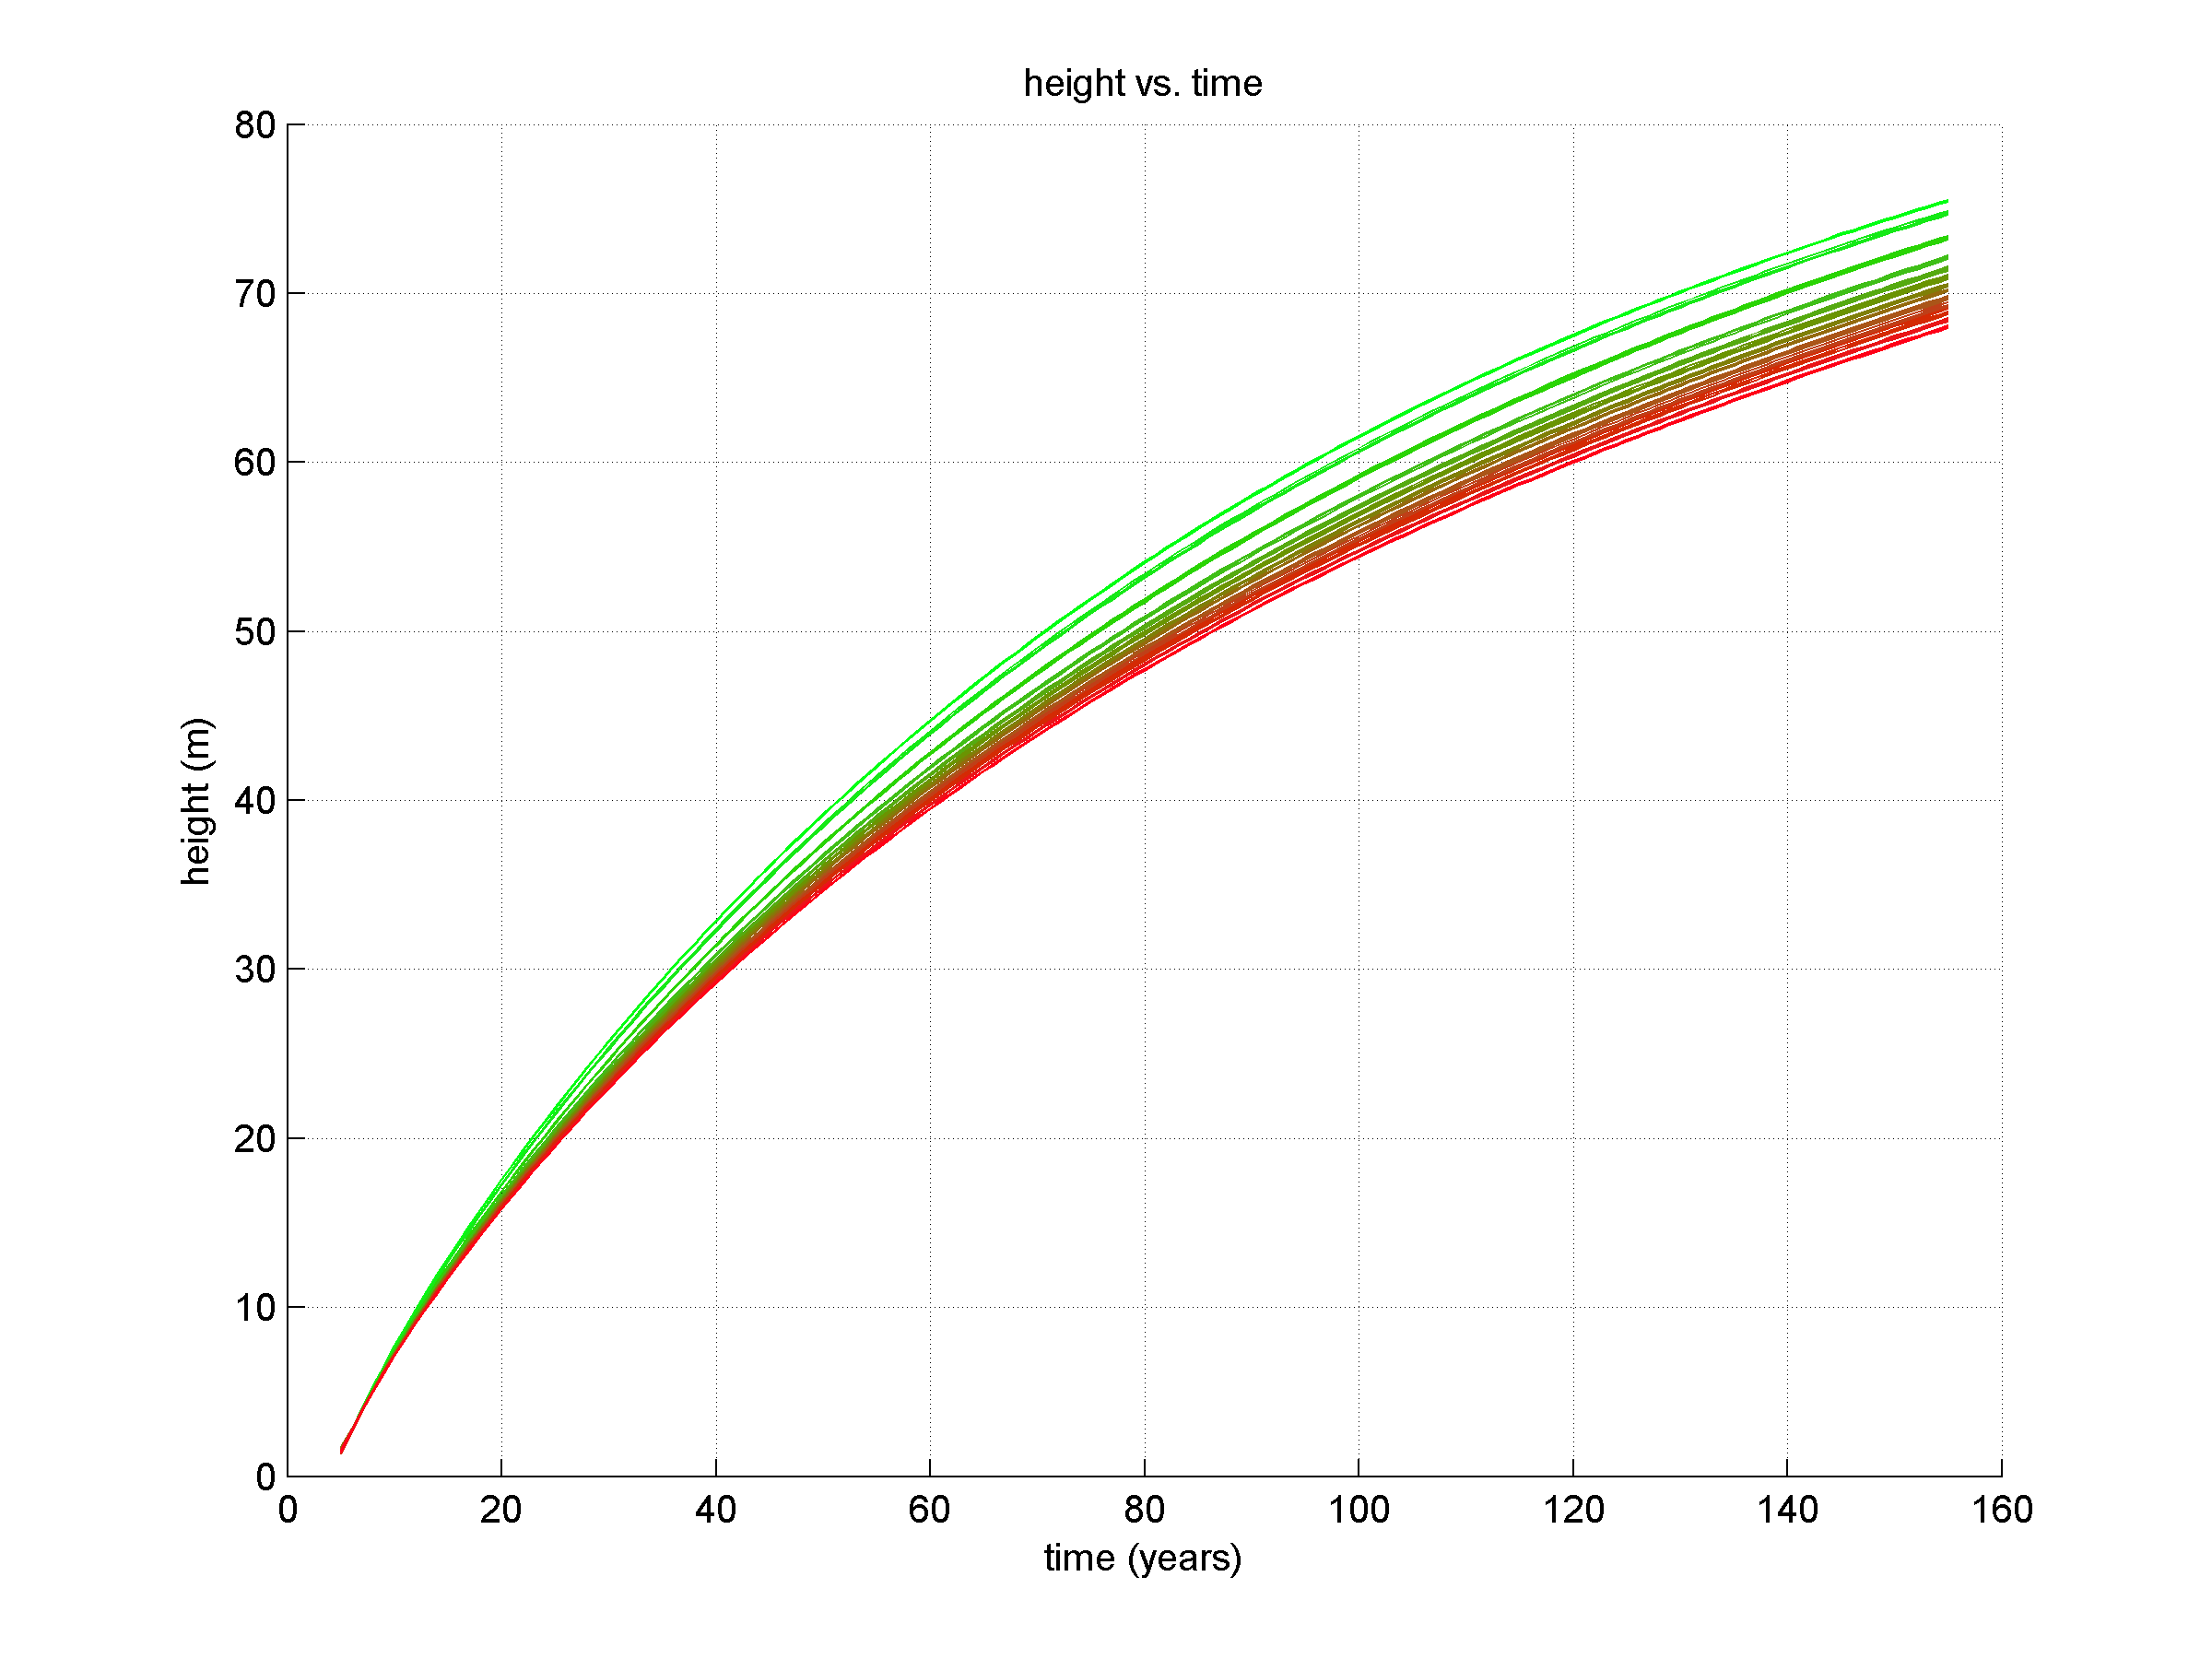
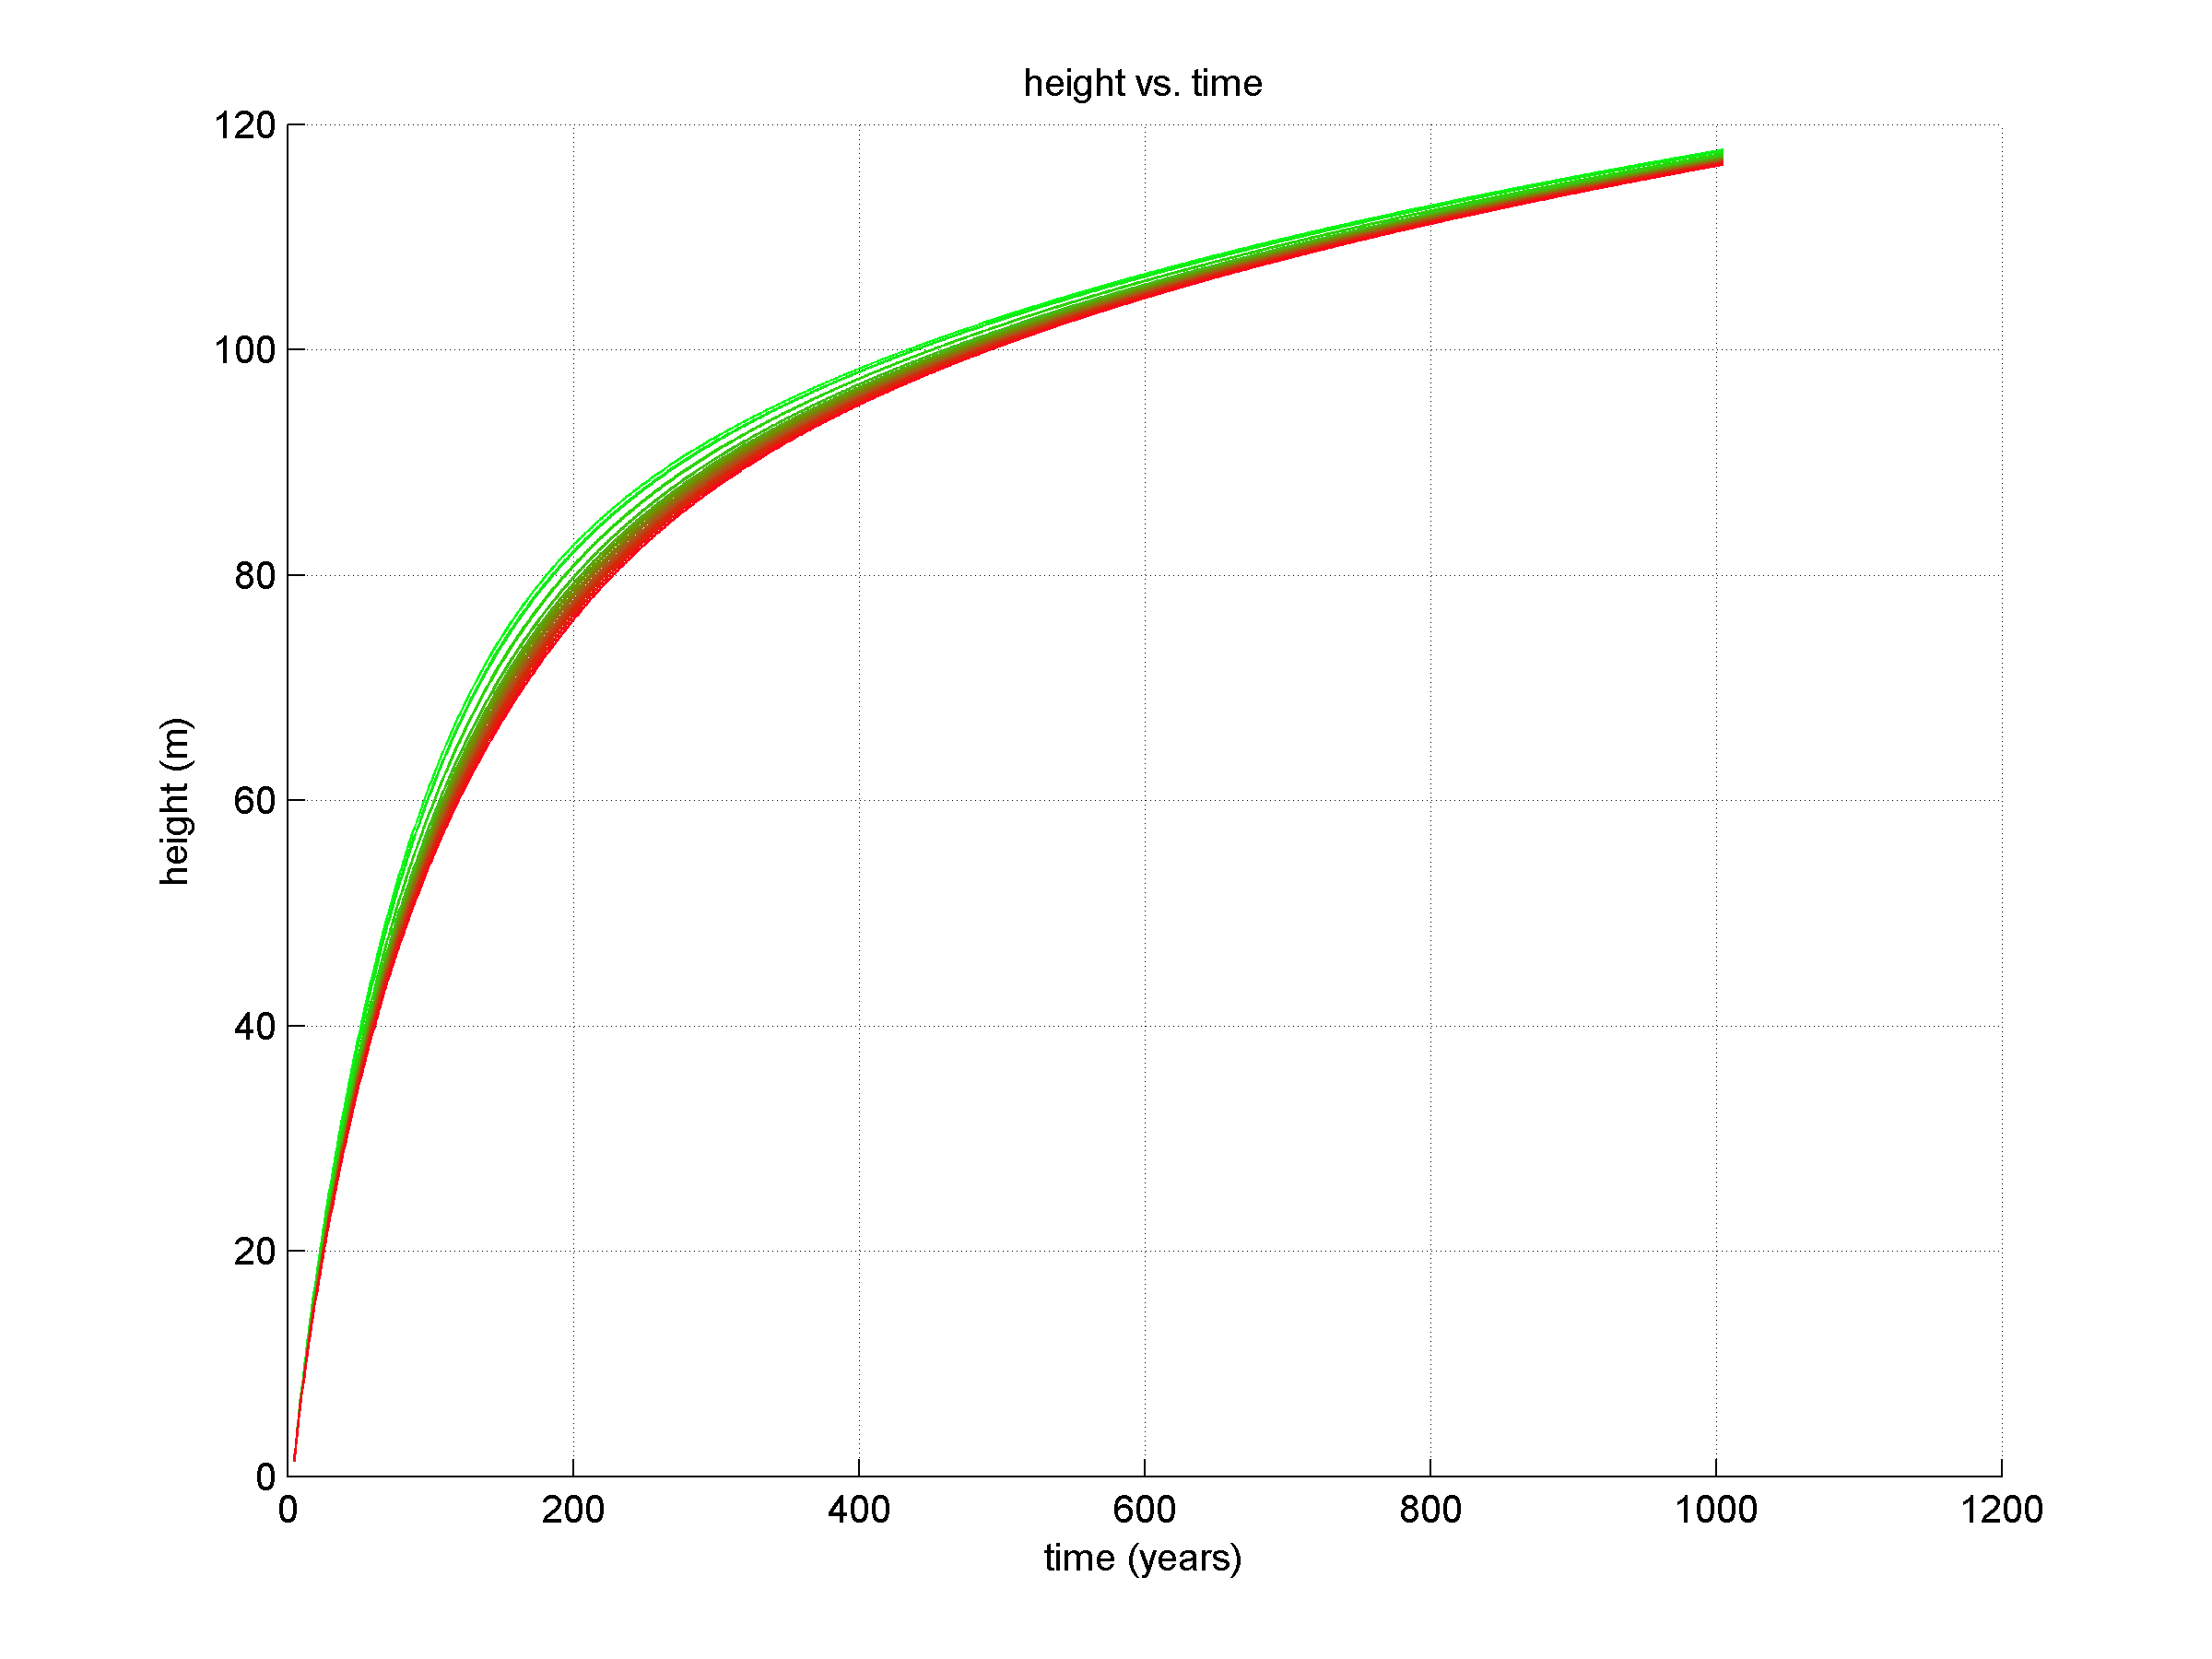
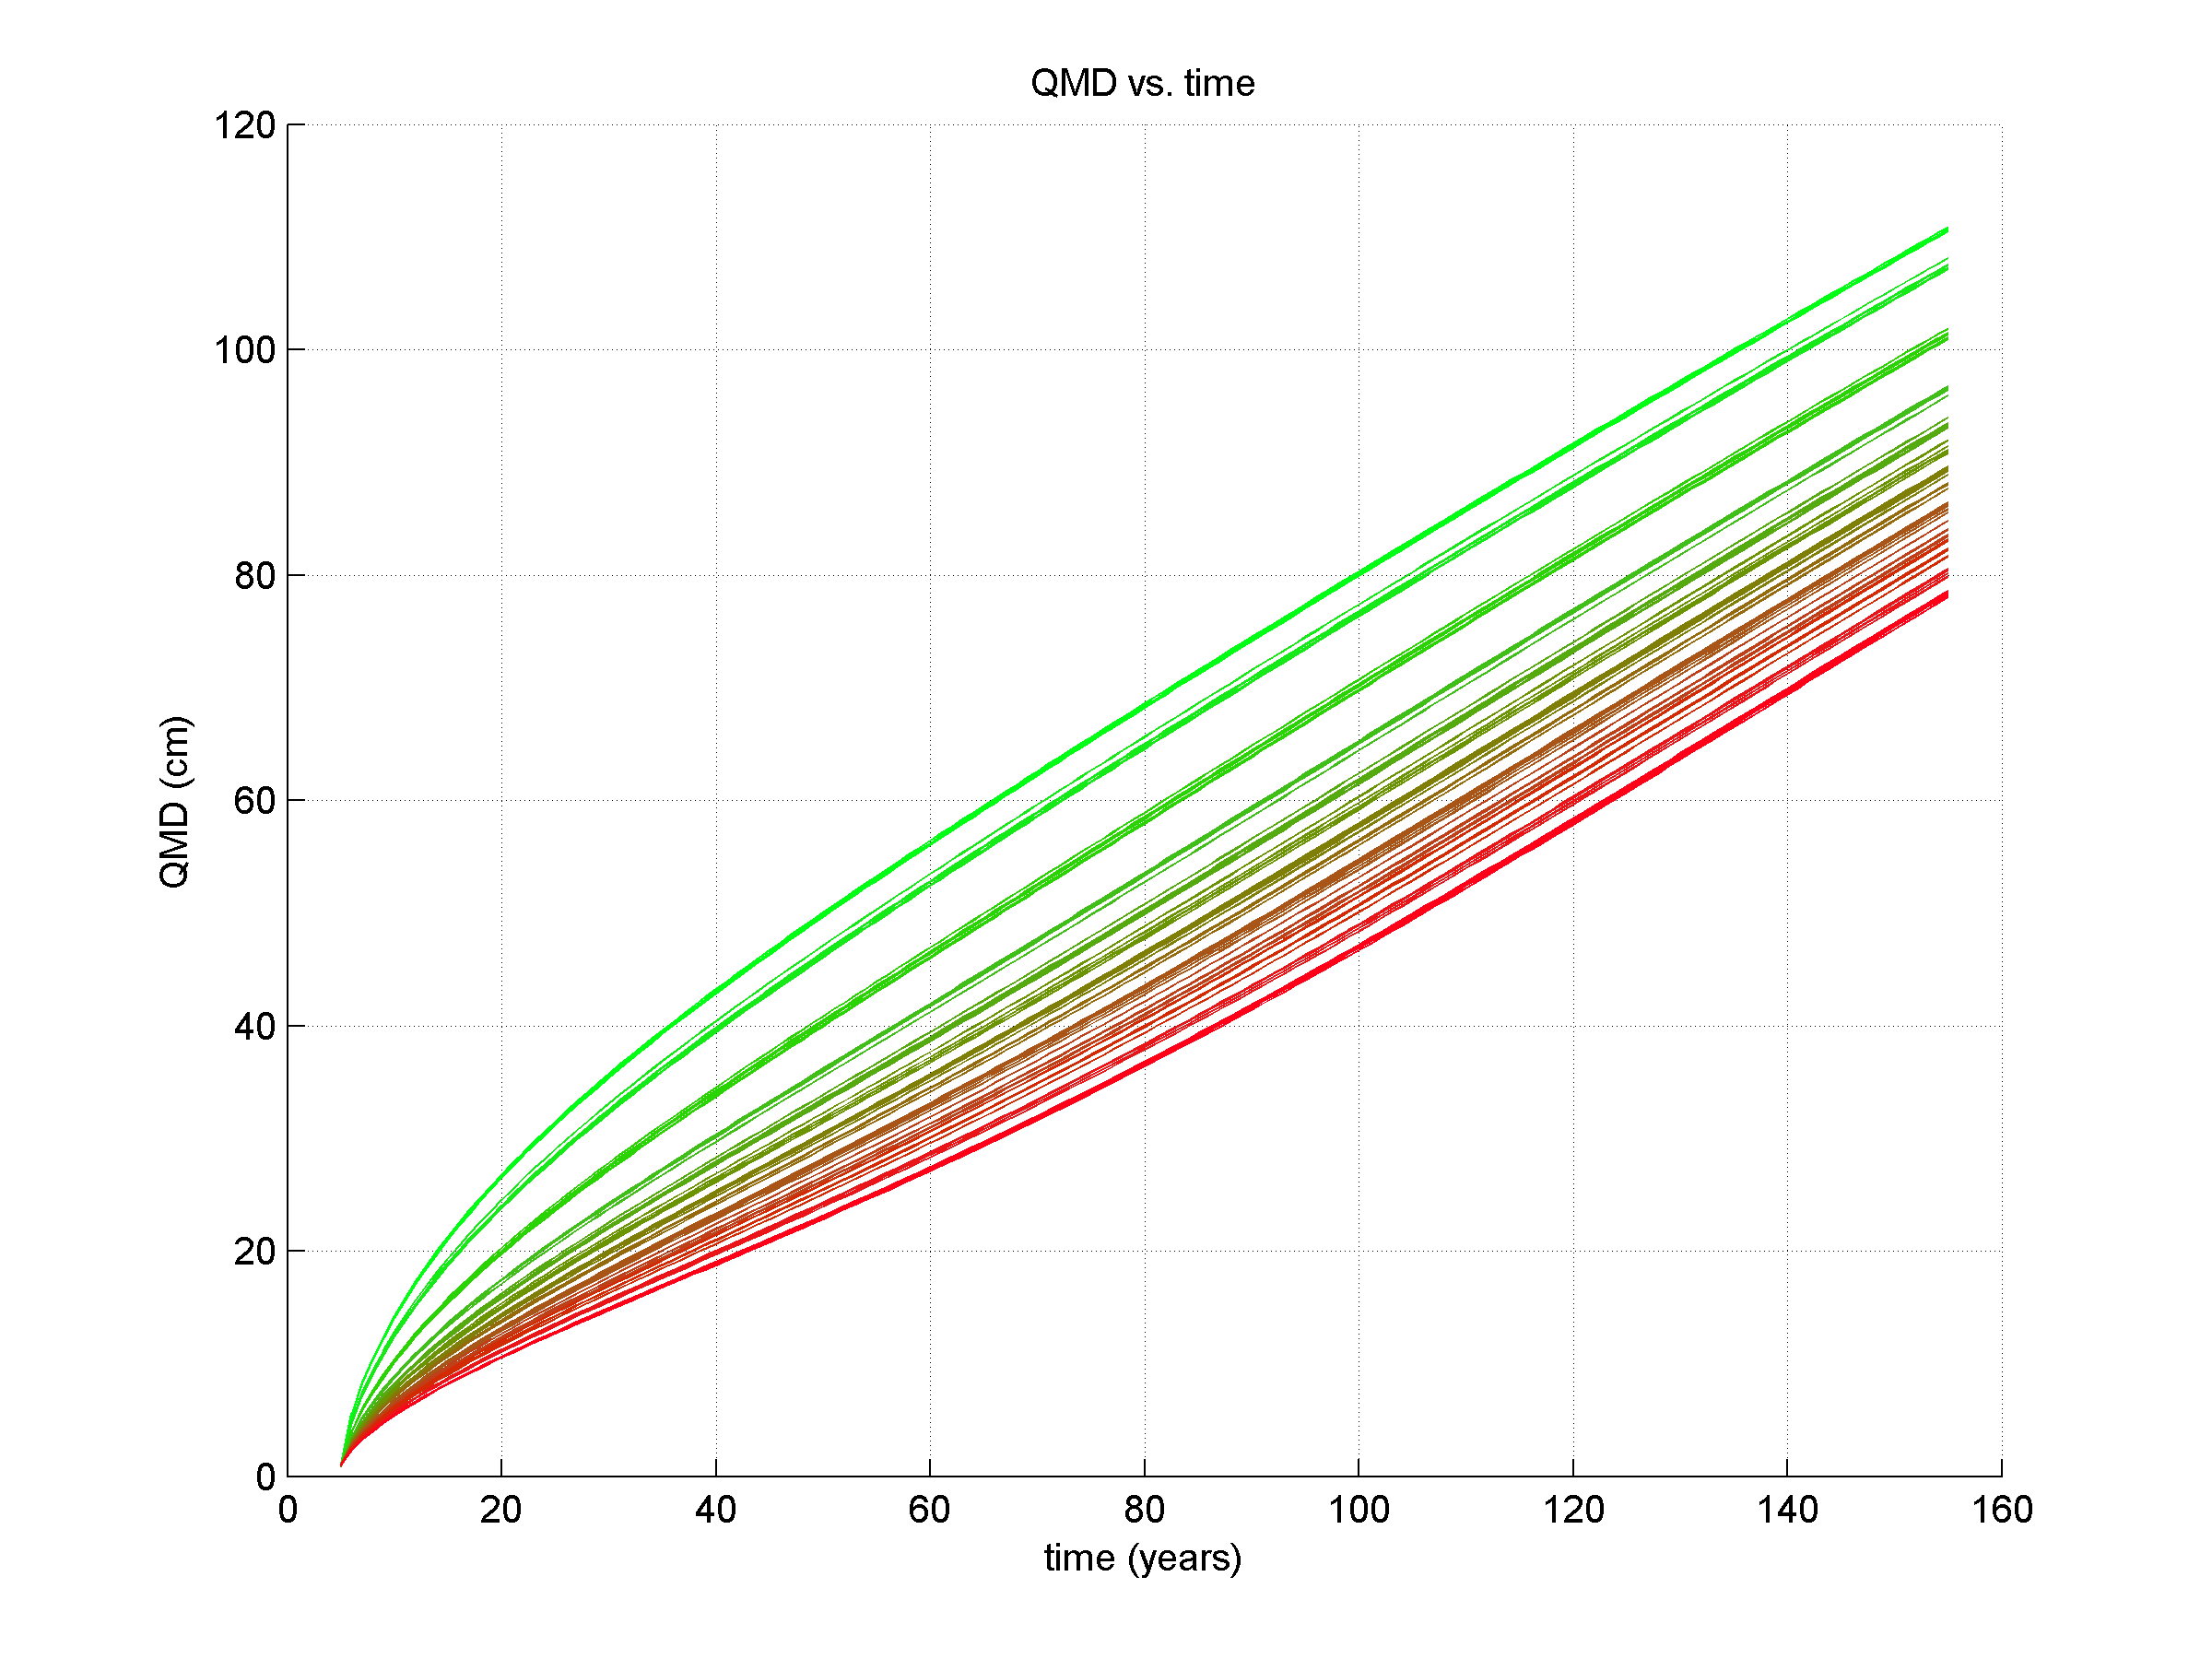
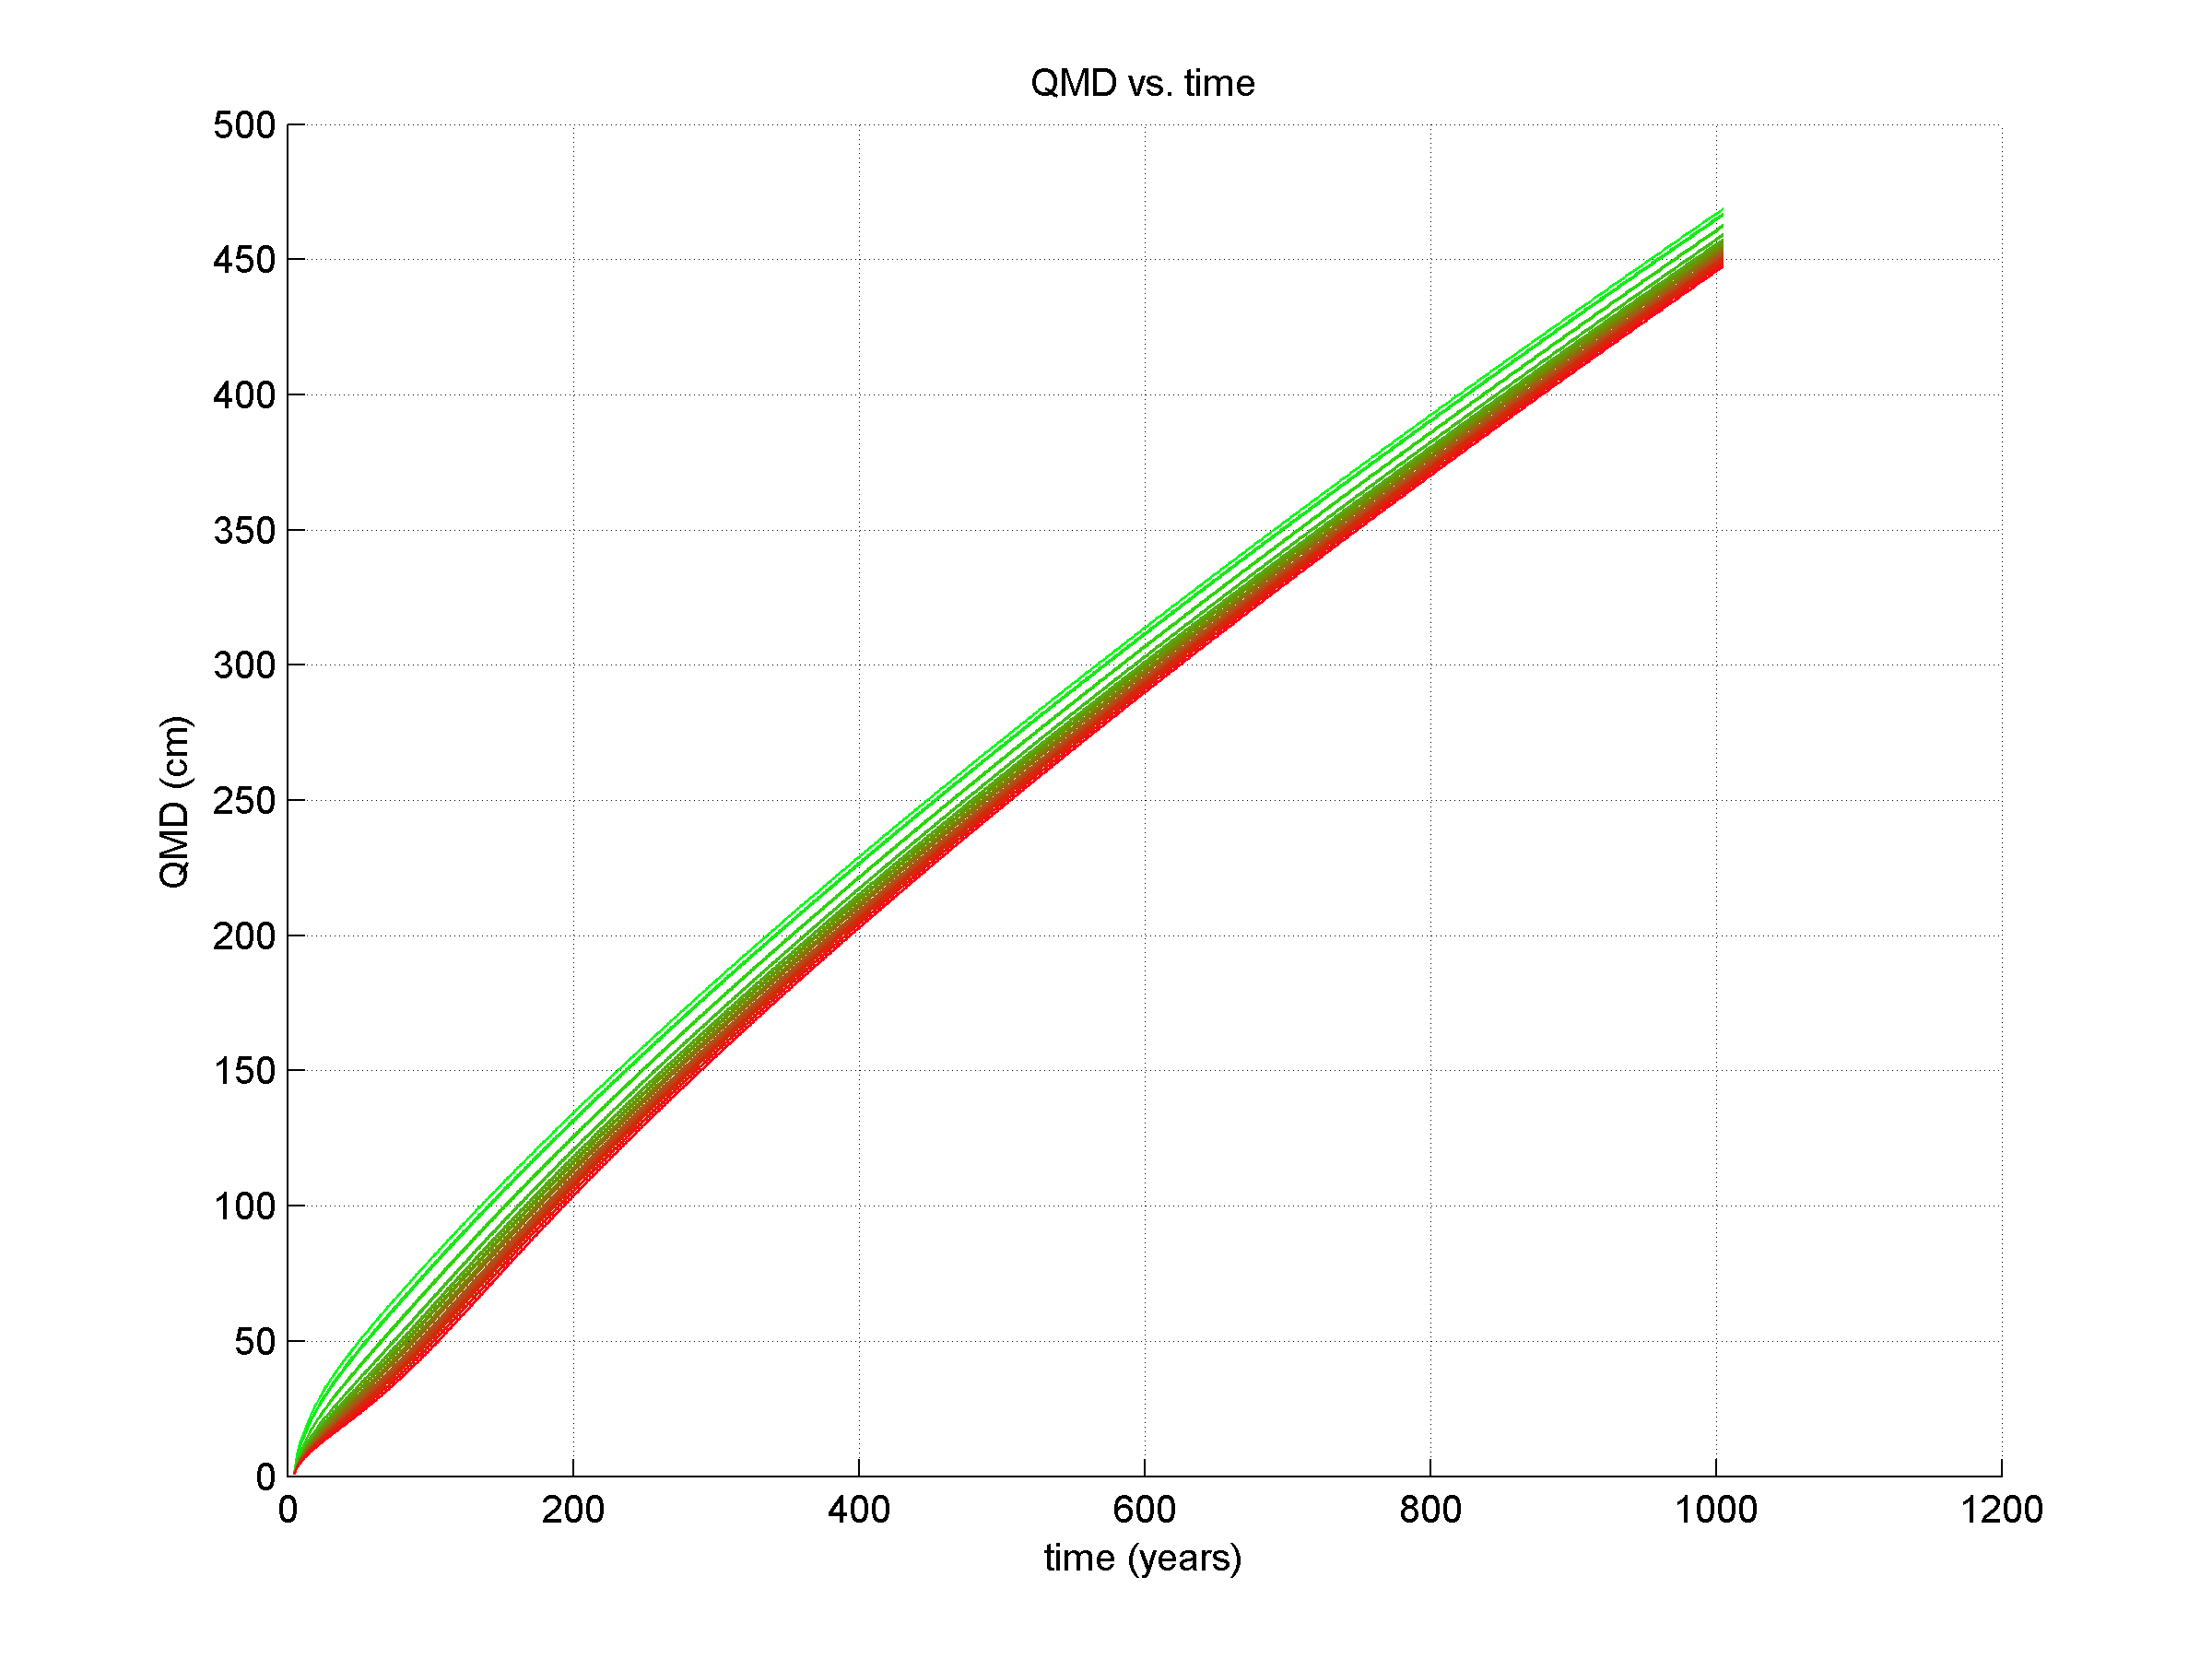
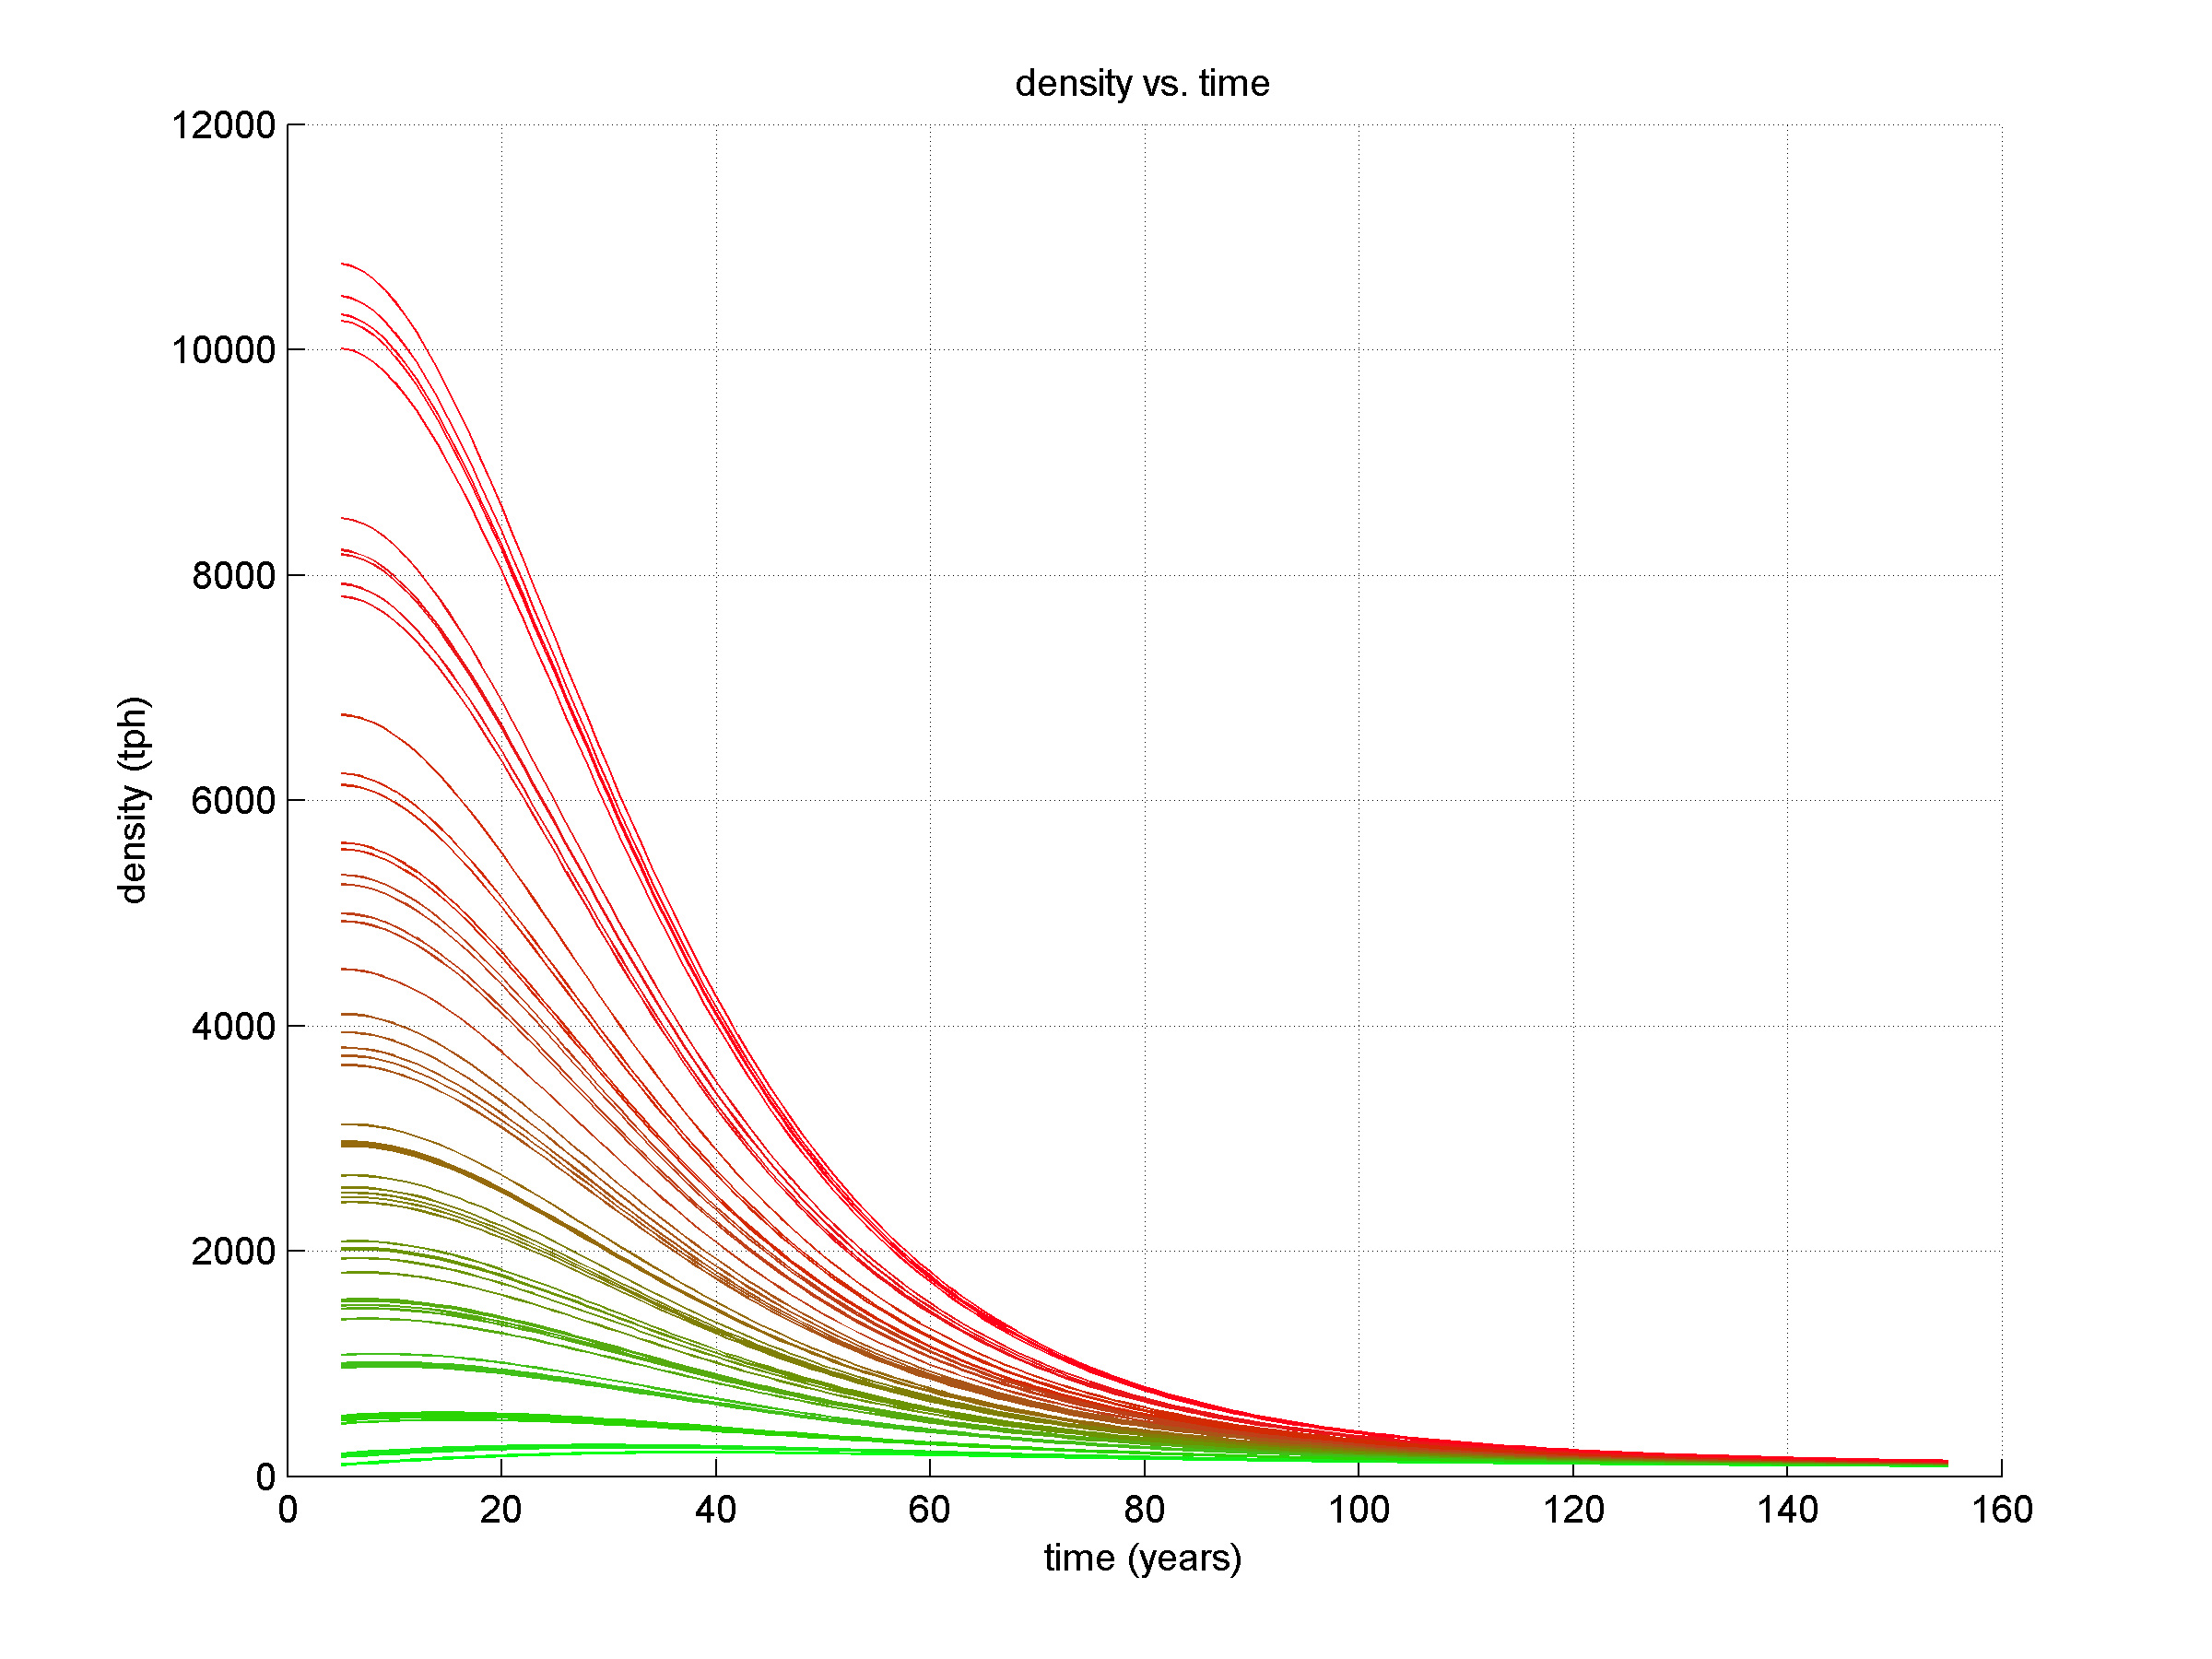
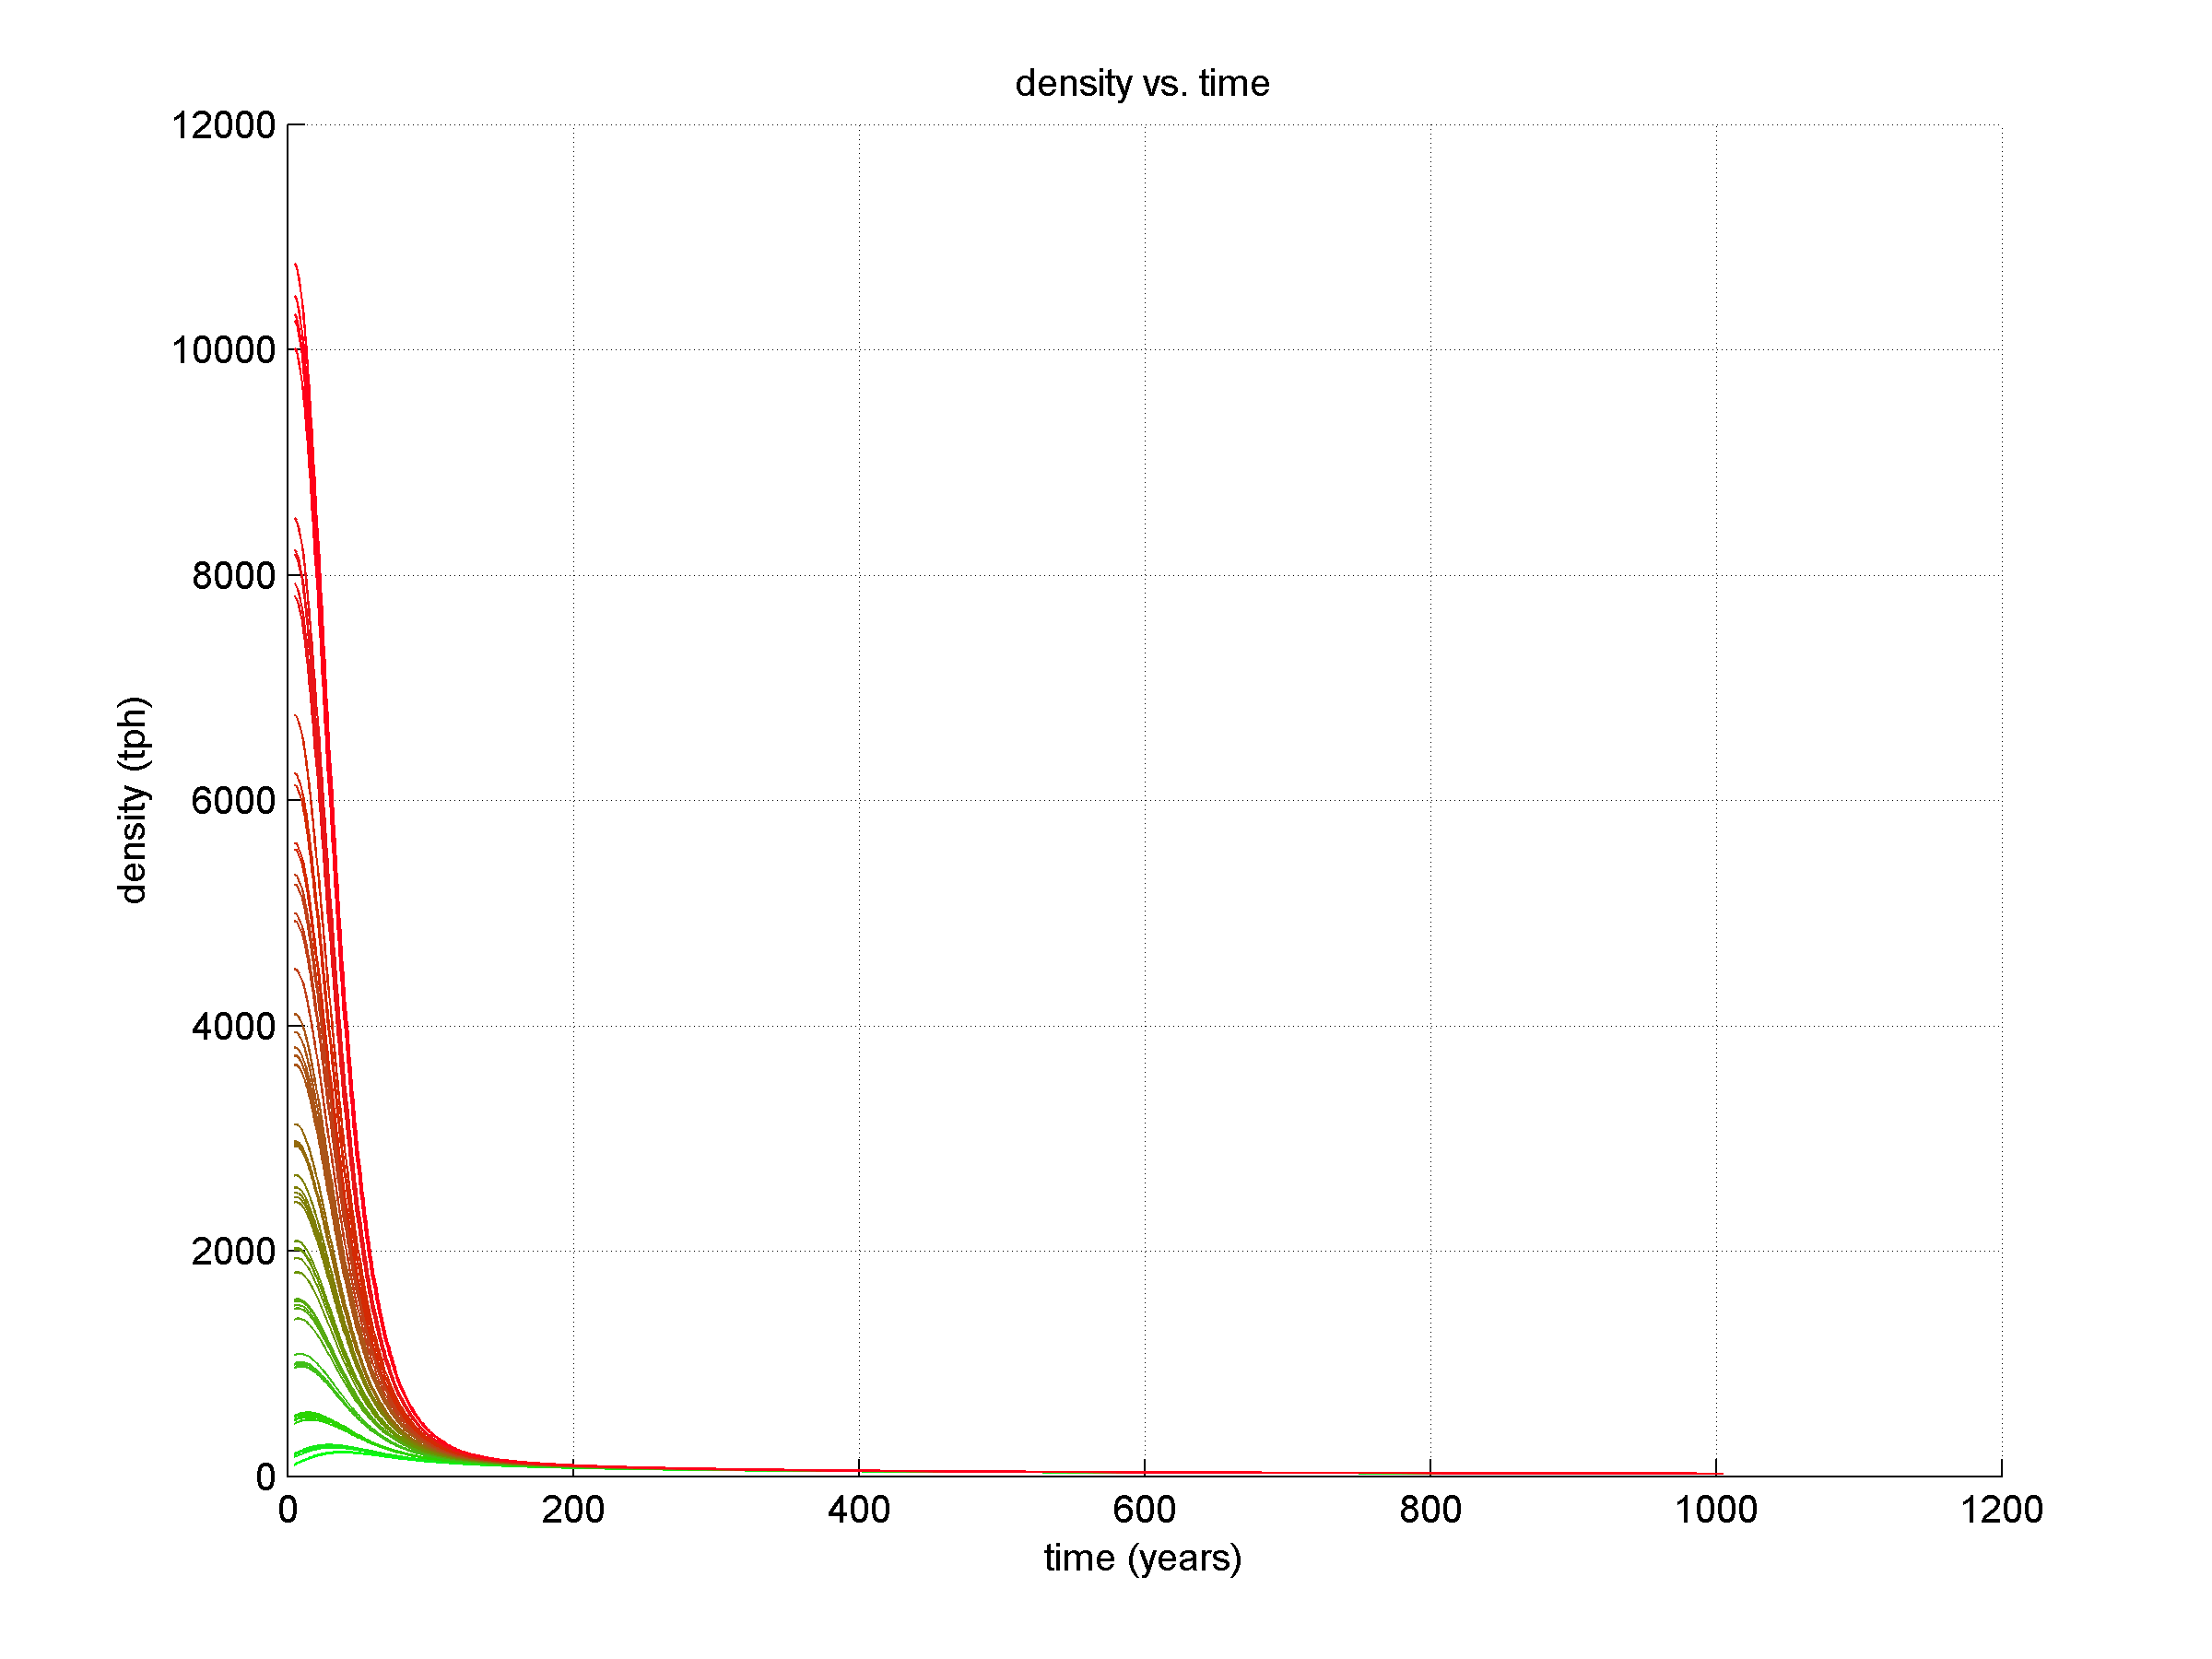
Example: Douglas-fir forest developmentData from 968 measurement intervals on planted and natural Douglas-fir stands distributed throughout western Washington, western Oregon, and southwestern British Columbia were used to model Douglas-fir stand development over time. The model consisted of a coupled system of three nonlinear differential equations representing the dynamics of stand density measured in trees per hectare (TPH), quadratic mean diameter (QMD), the diameter of a tree having the average cross sectional area at breast height, and dominant tree height, the average height of the largest trees. Model projections were made for a range of stand densities from 100 TPH to 10000 TPH using an initial average tree with a QMD of 1 cm and dominant height of 1.5 m for 150 year and 1000 year time intervals. The 150 year projections were intended to provide a straightforward comparison to the data.. The 1000 year projections were intended to demonstrate the self-limiting nature of the model, that is, the interactions between the average tree size and stand density that limit the maximum size of the trees over time. The 1000 year projections are consistent with known maximum sizes for Douglas-fir trees: 100-120 meters in height and 400-500 centimeters in diameter. Further, the maximum dominant tree height produced by the model is consistent with the known physiology of Douglas-fir trees. No explicit maximum tree size constraints were used in the model: the maximum sizes produced are emergent properties of the coupled differential equations in the model.
|


For information send email to:
info@biometricsnw.com
Last Update:
October 20, 2024
Copyright 2005-2024 Biometrics Northwest LLC